The instrument
Drag along the route — the seabed under the keel
Every 2 km from the Port of Churchill to the open Atlantic: measured depth in blue, model-inferred depth in amber with its calibrated σ band, and the water nobody can answer for yet in red. Hover for the provenance of each point: the CHS survey year and CATZOC grade under the keel, or the distance to the nearest sounding. Of the 198 points with a published sounding, 103 (52%) come from surveys before 1980. Trust grade along the route: A 17% · B 27% · C 34% · D 22%.
Exhibit Gtested on water it had never seen
Two independent tests, all the numbers, including the ones that hurt
A completion model is worth nothing until it is scored on depths it never trained on. We ran two such tests and publish both in full.
Test 1 — research-cruise multibeam
109,044 seabed cells on the shelf (50–400 m) measured by Amundsen, Healy, Knorr, Armstrong and Merian cruises (via GMRT/NCEI) where CHS has no published sounding. The model’s mean error, against 13.4 m for copying the nearest published sounding and 5.5 m for the gravity prior.
Test 2 — the future, hindcast
CHS’s own Survey Index dates every sounding to 2016. We retrained on the pre-2016 soundings only and scored the 6,460,612 corridor soundings CHS published after. Model 13.3 m · nearest old sounding 18.8 m · gravity 18.1 m. 74% of errors inside the model’s own 1σ.
σ recalibrated on independent cells
Raw σ was under-confident: only 48% of independent errors fell inside 1σ (68% expected). An isotonic map fitted on Test 1 fixes the scale (mean factor 1.9×); every σ on this page is the calibrated one. Ranking was already right (σ vs |error| correlation 0.30).
Where the model defers
Off the shelf, Test 1 shows gravity beats the model (6.3 vs 10.9 m below 1,000 m). Inferred cells deeper than 400 m now carry the gravity prior; 300–400 m is blended. Stated, not hidden.
| Distance to nearest sounding | SeabedNet (m) | Nearest sounding (m) | Gravity prior (m) |
|---|---|---|---|
| TEST 1 · INDEPENDENT MULTIBEAM, SHELF 50–400 M | |||
| 0–0.5 km | 4.8 | 8.5 | 5.9 |
| 0.5–1 km | 4.6 | 12.9 | 5.5 |
| 1–2 km | 5.0 | 17.5 | 4.8 |
| 2–4 km | 5.5 | 20.8 | 5.8 |
| Shelf, all distances — stronger baselines | 4.9 | gravity trend + natural-neighbour residual 11.2 · + inverse-distance residual 8.7 | 5.5 · GEBCO 3.0* |
| TEST 2 · PRE-2016 MODEL vs POST-2016 CHS SOUNDINGS, CORRIDOR | |||
| 0–0.5 km | 7.1 | 5.6 | 17.8 |
| 0.5–1 km | 10.9 | 11.8 | 17.9 |
| 1–2 km | 13.3 | 17.1 | 17.5 |
| 2–4 km | 15.6 | 25.4 | 18.2 |
| 4–8 km | 20.1 | 34.9 | 20.7 |
| All distances — stronger baselines | 13.3 | gravity trend + natural-neighbour residual 16.8 · + inverse-distance residual 16.2 | 18.9 · GEBCO 6.2* |
Baselines a hydrographer would actually use. Copying the nearest sounding is a floor, not a method. The classical gap fill is a gravity trend plus interpolated residuals; we report it two ways (Delaunay natural-neighbour and inverse-distance-squared on the 12 nearest residuals). On Test 1 the model beats both (4.9 vs 11.2 / 8.7 m); on Test 2, 13.3 vs 16.8 / 16.2 m. *GEBCO (NCEI global mosaic, 15 arc-second) is shown as the chart-world reference, not a baseline: it ingests NONNA-100 through IBCAO v5 (the Arctic Seabed 2030 compilation) and the same NCEI cruise archive, so it has seen both test sets; on the 100 m grid it scores 3.0 m (Test 1) and 6.2 m (Test 2) — lower than the model, and that is the point: those are the residuals of resampling data GEBCO already contains, not predictions. Where GEBCO has no source soundings it is SRTM15+, the gravity row above. Gravity leakage, measured. SRTM15+ V2.7 (April 2025) inherits the cumulative NCEI multibeam archive of its point releases, which is where the Test 1 cruises live. Its error on the Test 1 cells is 5.5 m against 15.2 m on 282,193 ordinary NONNA-sounded shelf cells in the same blocks: the prior has almost certainly seen the cruise data. That leakage favours the baseline, which the model still edges on Test 1; the model itself takes gravity as an input and inherits some of it. Test 2 is the clean comparison: NONNA shelf soundings SRTM15+ does not resolve, where gravity scores 18.1 m against the model’s 13.3 m.
What the tests do not support. Under 50 m of water the pre-2016 model reads 10–11 m too deep — the dangerous direction, and the reason the mean depth is the wrong target for navigation (see the hazard exhibit). Within 500 m of an old sounding, copying that sounding still beats the model (5.6 vs 7.1 m); the model earns its keep beyond that. Test 2 is the full-size (34.8M-parameter) model, trained 17 minutes on a rented RTX 5090; the 6.8M model scored 13.5 m on the same test, so size is not what limits this. Coastal cells under 50 m in Test 1 disagree with every source including CHS’s own nearest sounding and are excluded pending a look at the GMRT coastline product.
Exhibit Ithe hazard field
Ships do not ground on the mean depth. This predicts the shallowest point.
Every bathymetry model, including the one above, predicts the average depth of a 100 m cell. A keel meets the shallowest rock in it. Where CHS holds both 10 m and 100 m data, the shallowest point within 500 m sits a median 6 m above the 100 m mean on this route. So we trained a second, 34.8M-parameter model on 475 NONNA-10/100 tile pairs to predict that shallowest point and its uncertainty, and turned it into one number per cell: the probability that a 10.5 m draft touches.
Shallowest-point error, held-out tiles
Mean error of the predicted shallowest depth within 500 m on tiles held out around the grounding sites, against 10.98 m if you assume the archive’s 100 m depth is the shallowest point, and 12.31 m for gravity. Where no sounding exists at all: 8.25 m vs 11.03 m. Bands: 81% inside 1σ, 96% inside 2σ.
Route the mean map calls safe, the hazard field does not
Of 1762 km of route deeper than 21 m on the mean map, 26 km carry more than a 5% chance that the shallowest point within 500 m is above a 10.5 m keel. Corridor-wide: 18.3% of cells exceed 5%, 15.9% exceed 20%.

The groundings that already happened, hindcast
For each TSB-documented Arctic grounding we gave the hazard model only the soundings that existed before the ship hit (dated by CHS’s Survey Index) and asked what percentile of danger the strike site got among the water that looked safe on the mean map within 25 km. On 5 of 7 scored groundings the hazard field placed the strike site in the top 10% of danger among water that looked safe on the mean map (Thamesborg 96th, Akademik Ioffe 93rd, Hanseatic 99th, Nanny 2012 95th, Mokami 2000 95th). It missed Clipper Adventurer (84th), Nanny 2014 (79th). Baselines: the mean model’s own σ (“where it is blind”) and the shallowness of the nearest old sounding.
| Grounding | Pre-incident soundings in block | km to nearest | P(shoal < draft) at site | Hazard percentile | Mean-σ percentile | Nearest-sounding percentile |
|---|---|---|---|---|---|---|
| Thamesborg 2025-09-06 · TSB M25C0241 | 1,000,495 | 0.8 | 27% | 96 | 99 | 90 |
| Akademik Ioffe 2018-08-24 · TSB M18C0225 | 165,454 | 9.4 | 26% | 93 | 77 | 90 |
| Clipper Adventurer 2010-08-27 · TSB M10H0006 | 16,457 | 12.4 | 19% | 84 | 11 | 22 |
| Hanseatic 1996-08-29 · TSB M96H0016 | 148,672 | 0.3 | 94% | 99 | 18 | 91 |
| Nanny 2012 2012-10-25 · TSB M12H0012 | 12,501 | 6.3 | 95% | 95 | 74 | 98 |
| Nanny 2014 2014-10-14 · TSB M14C0219 | 36,222 | 0.0 | 62% | 79 | 98 | 82 |
| Mokami 2000 2000-10-31 · TSB M00N0098 | 208,248 | 0.0 | 82% | 95 | 11 | 94 |
The same hindcast, blind, and how much the denominator matters
The table above still lets the model see every published sounding around a site at inference time, and NONNA carries no dates after 2016, so a post-grounding survey could be in that input. Here every sounding within 10 km of each site is removed from the input as well (the hazard model was trained with every tile group within 0.4° of the sites excluded from the start), and a 25 km hole is shown too: at 25 km the site falls outside the model’s inference envelope and it returns no estimate, which is the right answer, not a miss. Then the two choices that set the percentile — the comparison window and the definition of “looked safe” — are varied. Thamesborg with a 10 km hole in its input: 93rd percentile, nearest remaining sounding 10.0 km away, absolute P(shoal < draft) 1.4%.
| Grounding | Input: all soundings | Input: 10 km hole | Input: 25 km hole | 10 km hole, 10 km window | 10 km hole, 50 km window | 10 km hole, safe = 1.5× draft | 10 km hole, safe = 3× draft |
|---|---|---|---|---|---|---|---|
| Thamesborg | 96 | 93 | — | 91 | 90 | 92 | 94 |
| Akademik Ioffe | 93 | 94 | — | 74 | 98 | 93 | 94 |
| Clipper Adventurer | 84 | 84 | — | 99 | 83 | 83 | 84 |
| Hanseatic | 99 | 95 | — | 86 | 95 | 86 | 99 |
| Nanny 2012 | 95 | 96 | — | 100 | 97 | 95 | 98 |
| Nanny 2014 | 79 | 60 | — | 33 | 70 | 53 | 73 |
| Mokami 2000 | 95 | 67 | — | 81 | 80 | 63 | 76 |
Skill, not recall. By construction 10% of apparently-safe cells sit above the 90th percentile, so the base rate is known exactly. With the 10 km hole, 4 of 7 sites land above it (binomial p = 0.0027); on the four uncharted-shoal groundings alone, 3 of 4 (p = 0.0037). With all soundings visible: 5 of 7 (p = 0.0002). The precision side of the ledger is stated too: corridor-wide, 18% of cells exceed P = 5%, and on the route 26 km of 1762 apparently-safe km are flagged. 7 incidents cannot bound a false-alarm rate; what the flags buy is a survey order, and the survey is what tests them.
Thamesborg (table above) uses all published soundings because NONNA carries no dates after 2016; its position is from AIS and press, not TSB. Akademik Ioffe and Clipper Adventurer sit 9–12 km from any pre-incident sounding, at the edge of what any completion should be trusted for; their scores are reported anyway. The two Nanny groundings and Mokami 2000 (Bridges Passage, Labrador: a buoy 160 m off station and a datum mismatch) were navigation errors in known narrows and are included as controls, not claims; the hazard model’s training did not exclude the Mokami tiles, so that row is not blind at the training level. Why 7 and not fifty. The TSB counts 74 grounding or bottom-contact occurrences in the Canadian Arctic for 2000–2018 alone, but the occurrence-level list is not public; these 7 are every one for which a position can be sourced from a TSB report. Four more are known by place name only (Nanny 2010, Simpson Strait; Mokami 2010, Pangnirtung; Dorsch 2012, Regina Narrows; Rosaire A. Desgagnés 2025, position disputed) and are not scored. A request to the TSB for the occurrence list with coordinates would turn this table into the full record. Full per-site JSON in the validation repo.
The corridor, rendered
Six places, fully built: the seabed the model completed, the claims on it, and the ships that found the rocks first
Frames from the interactive globe, rendered at 4K from the same data as every number on this page: 10 m relief where CHS holds it, model-completed at 100 m elsewhere, Sentinel-2 imagery on land, the sea surface drawn to the exact coastline. Click a frame for the full-resolution file.
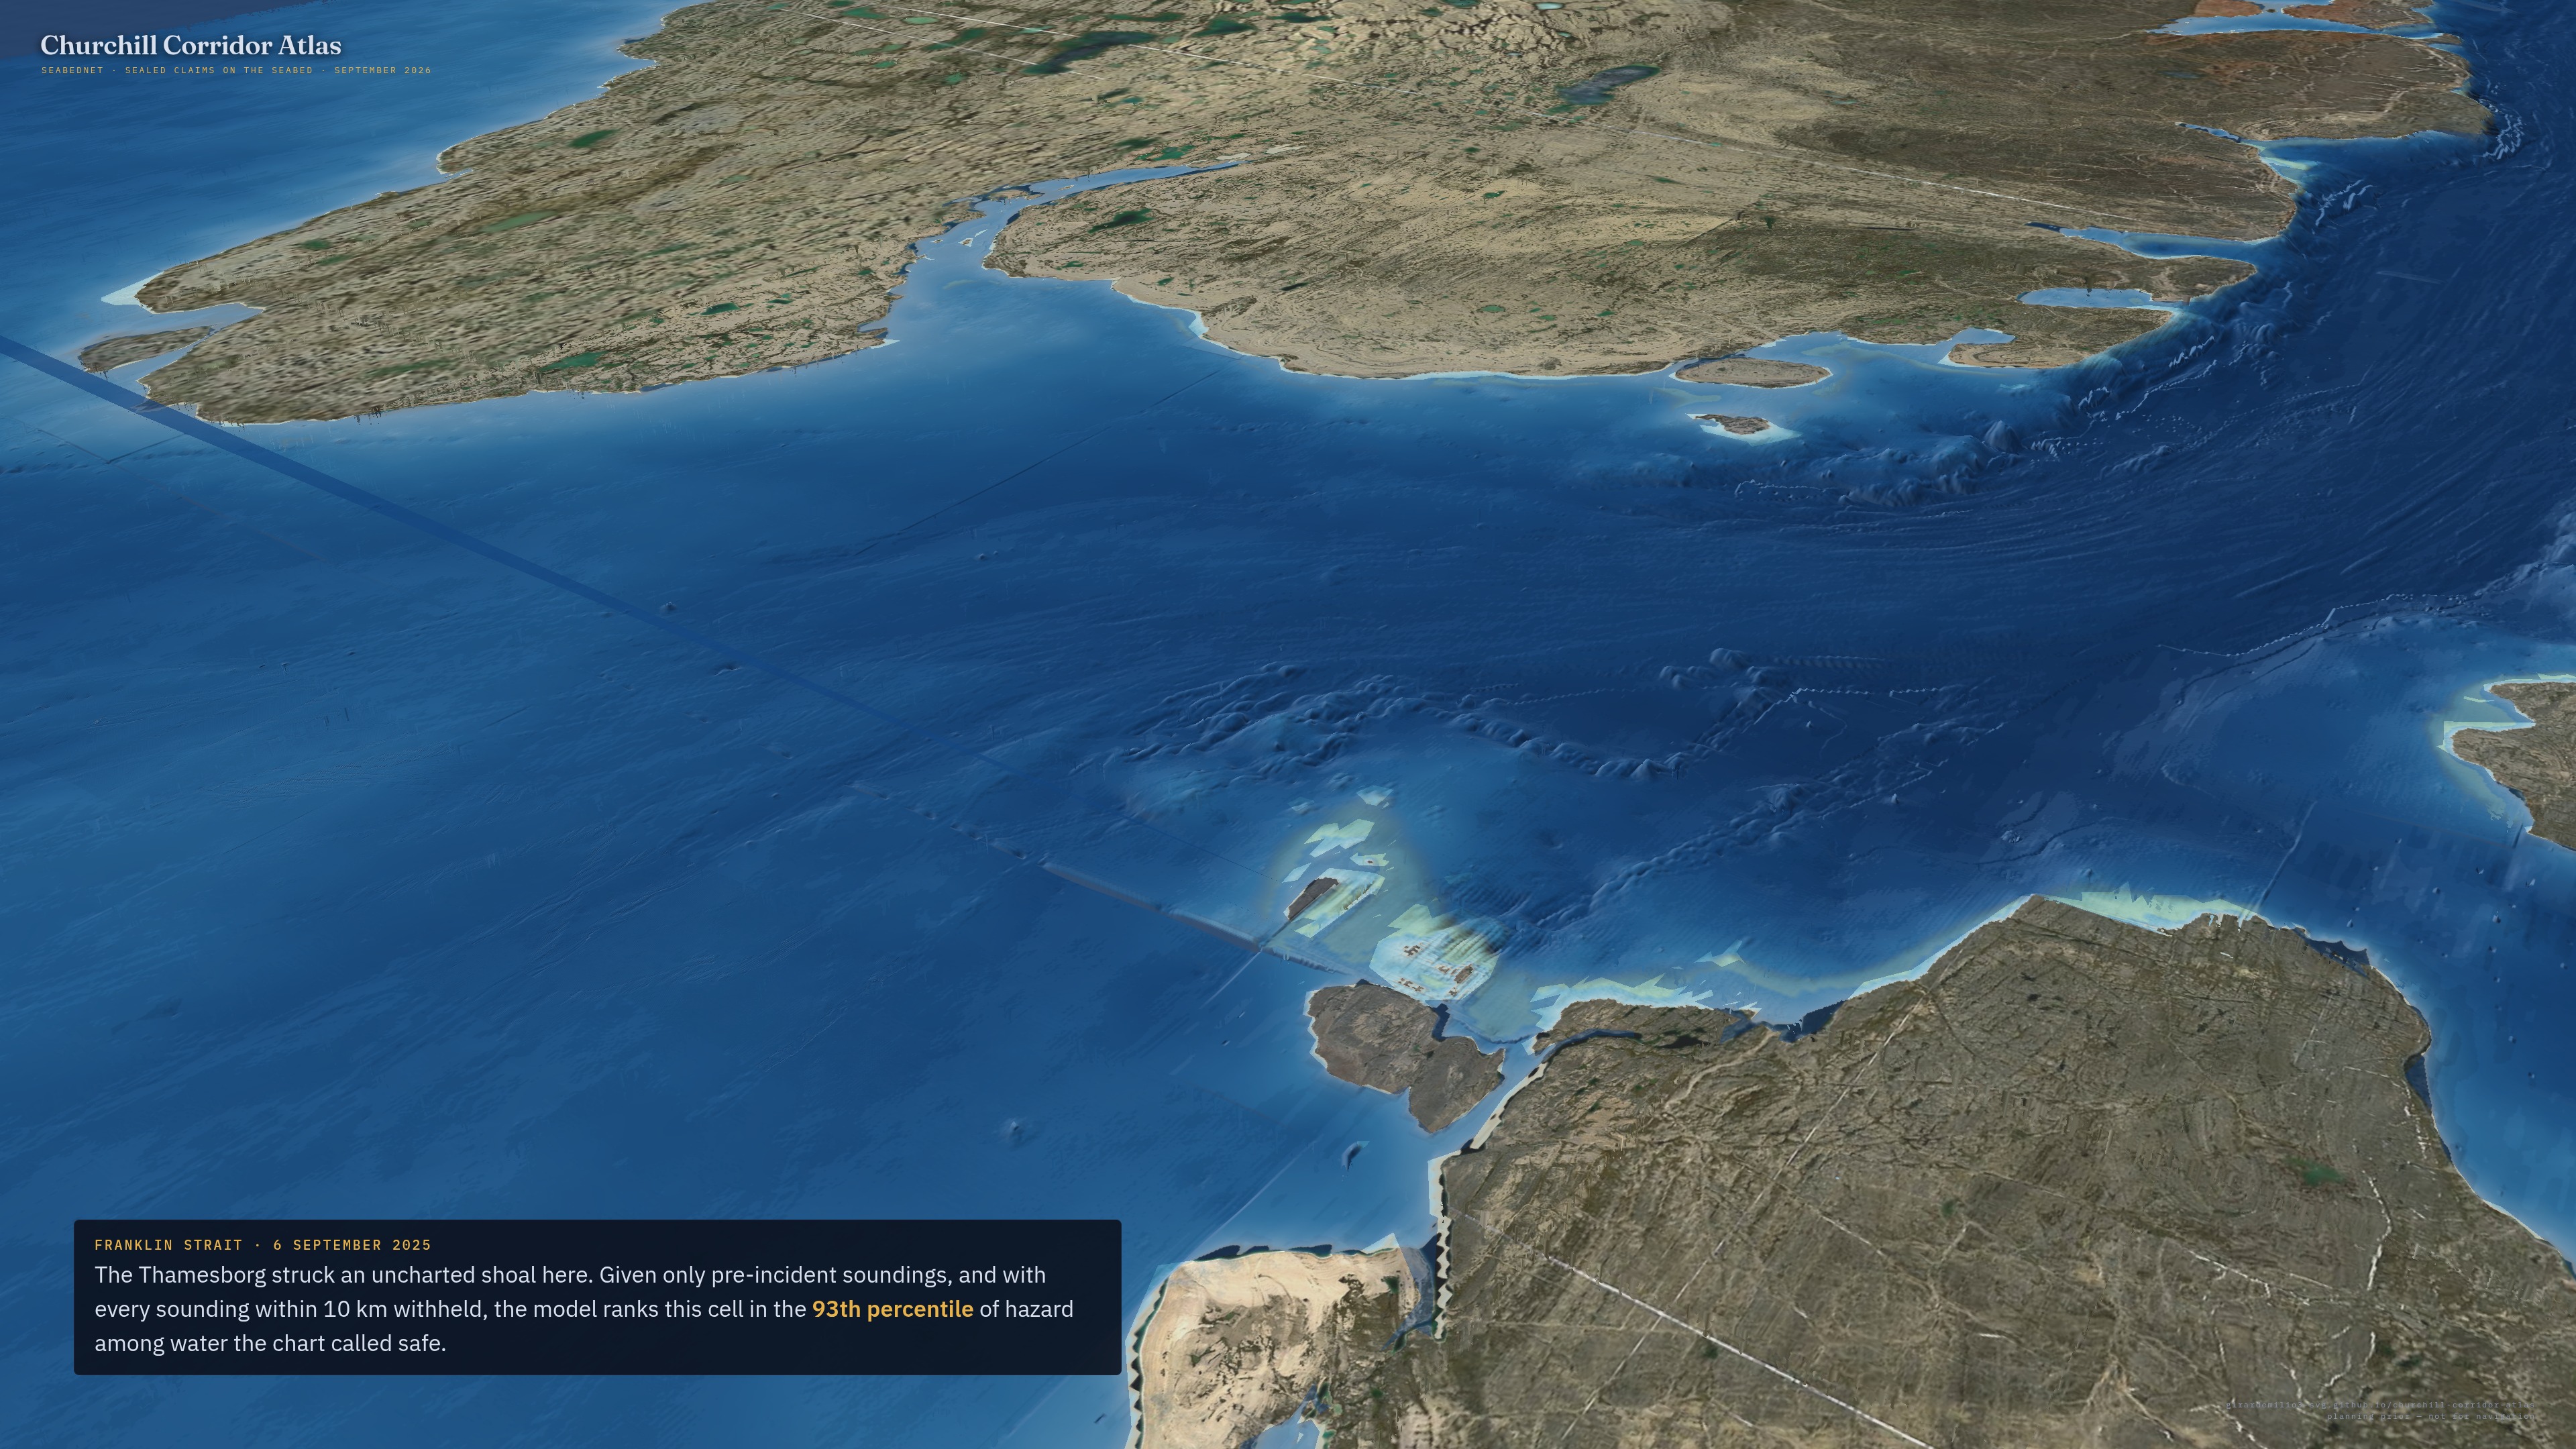
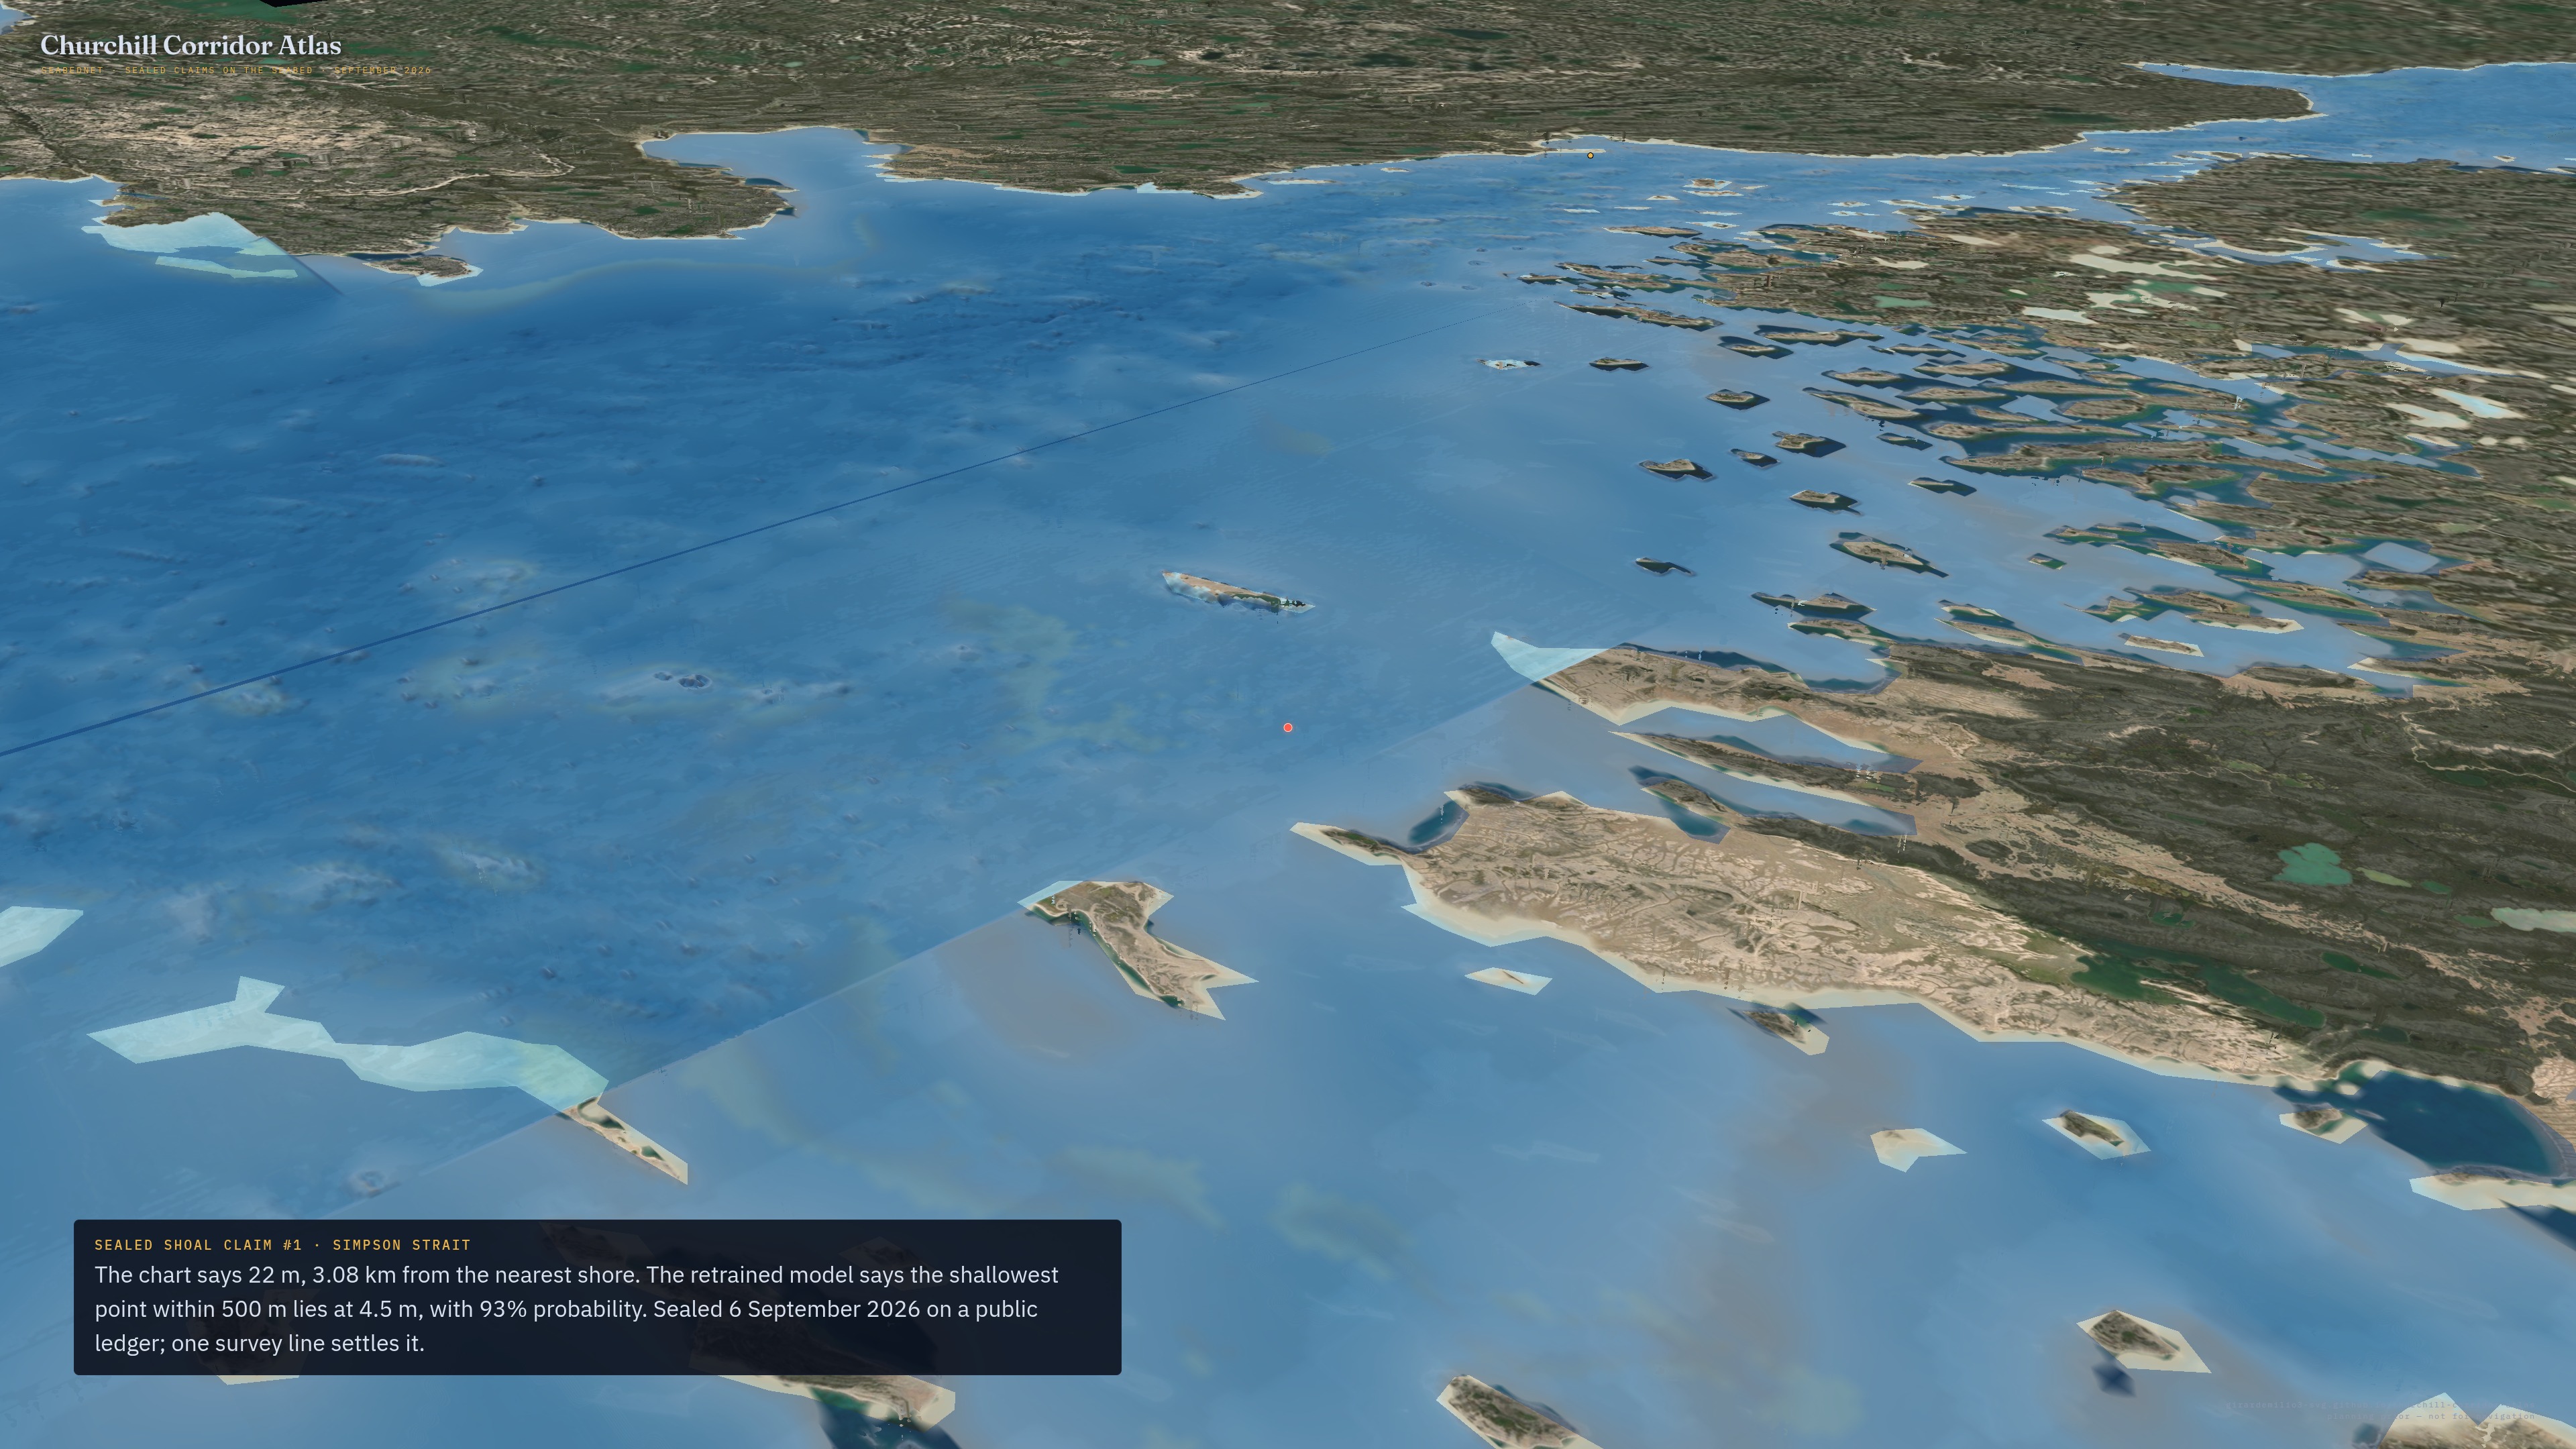
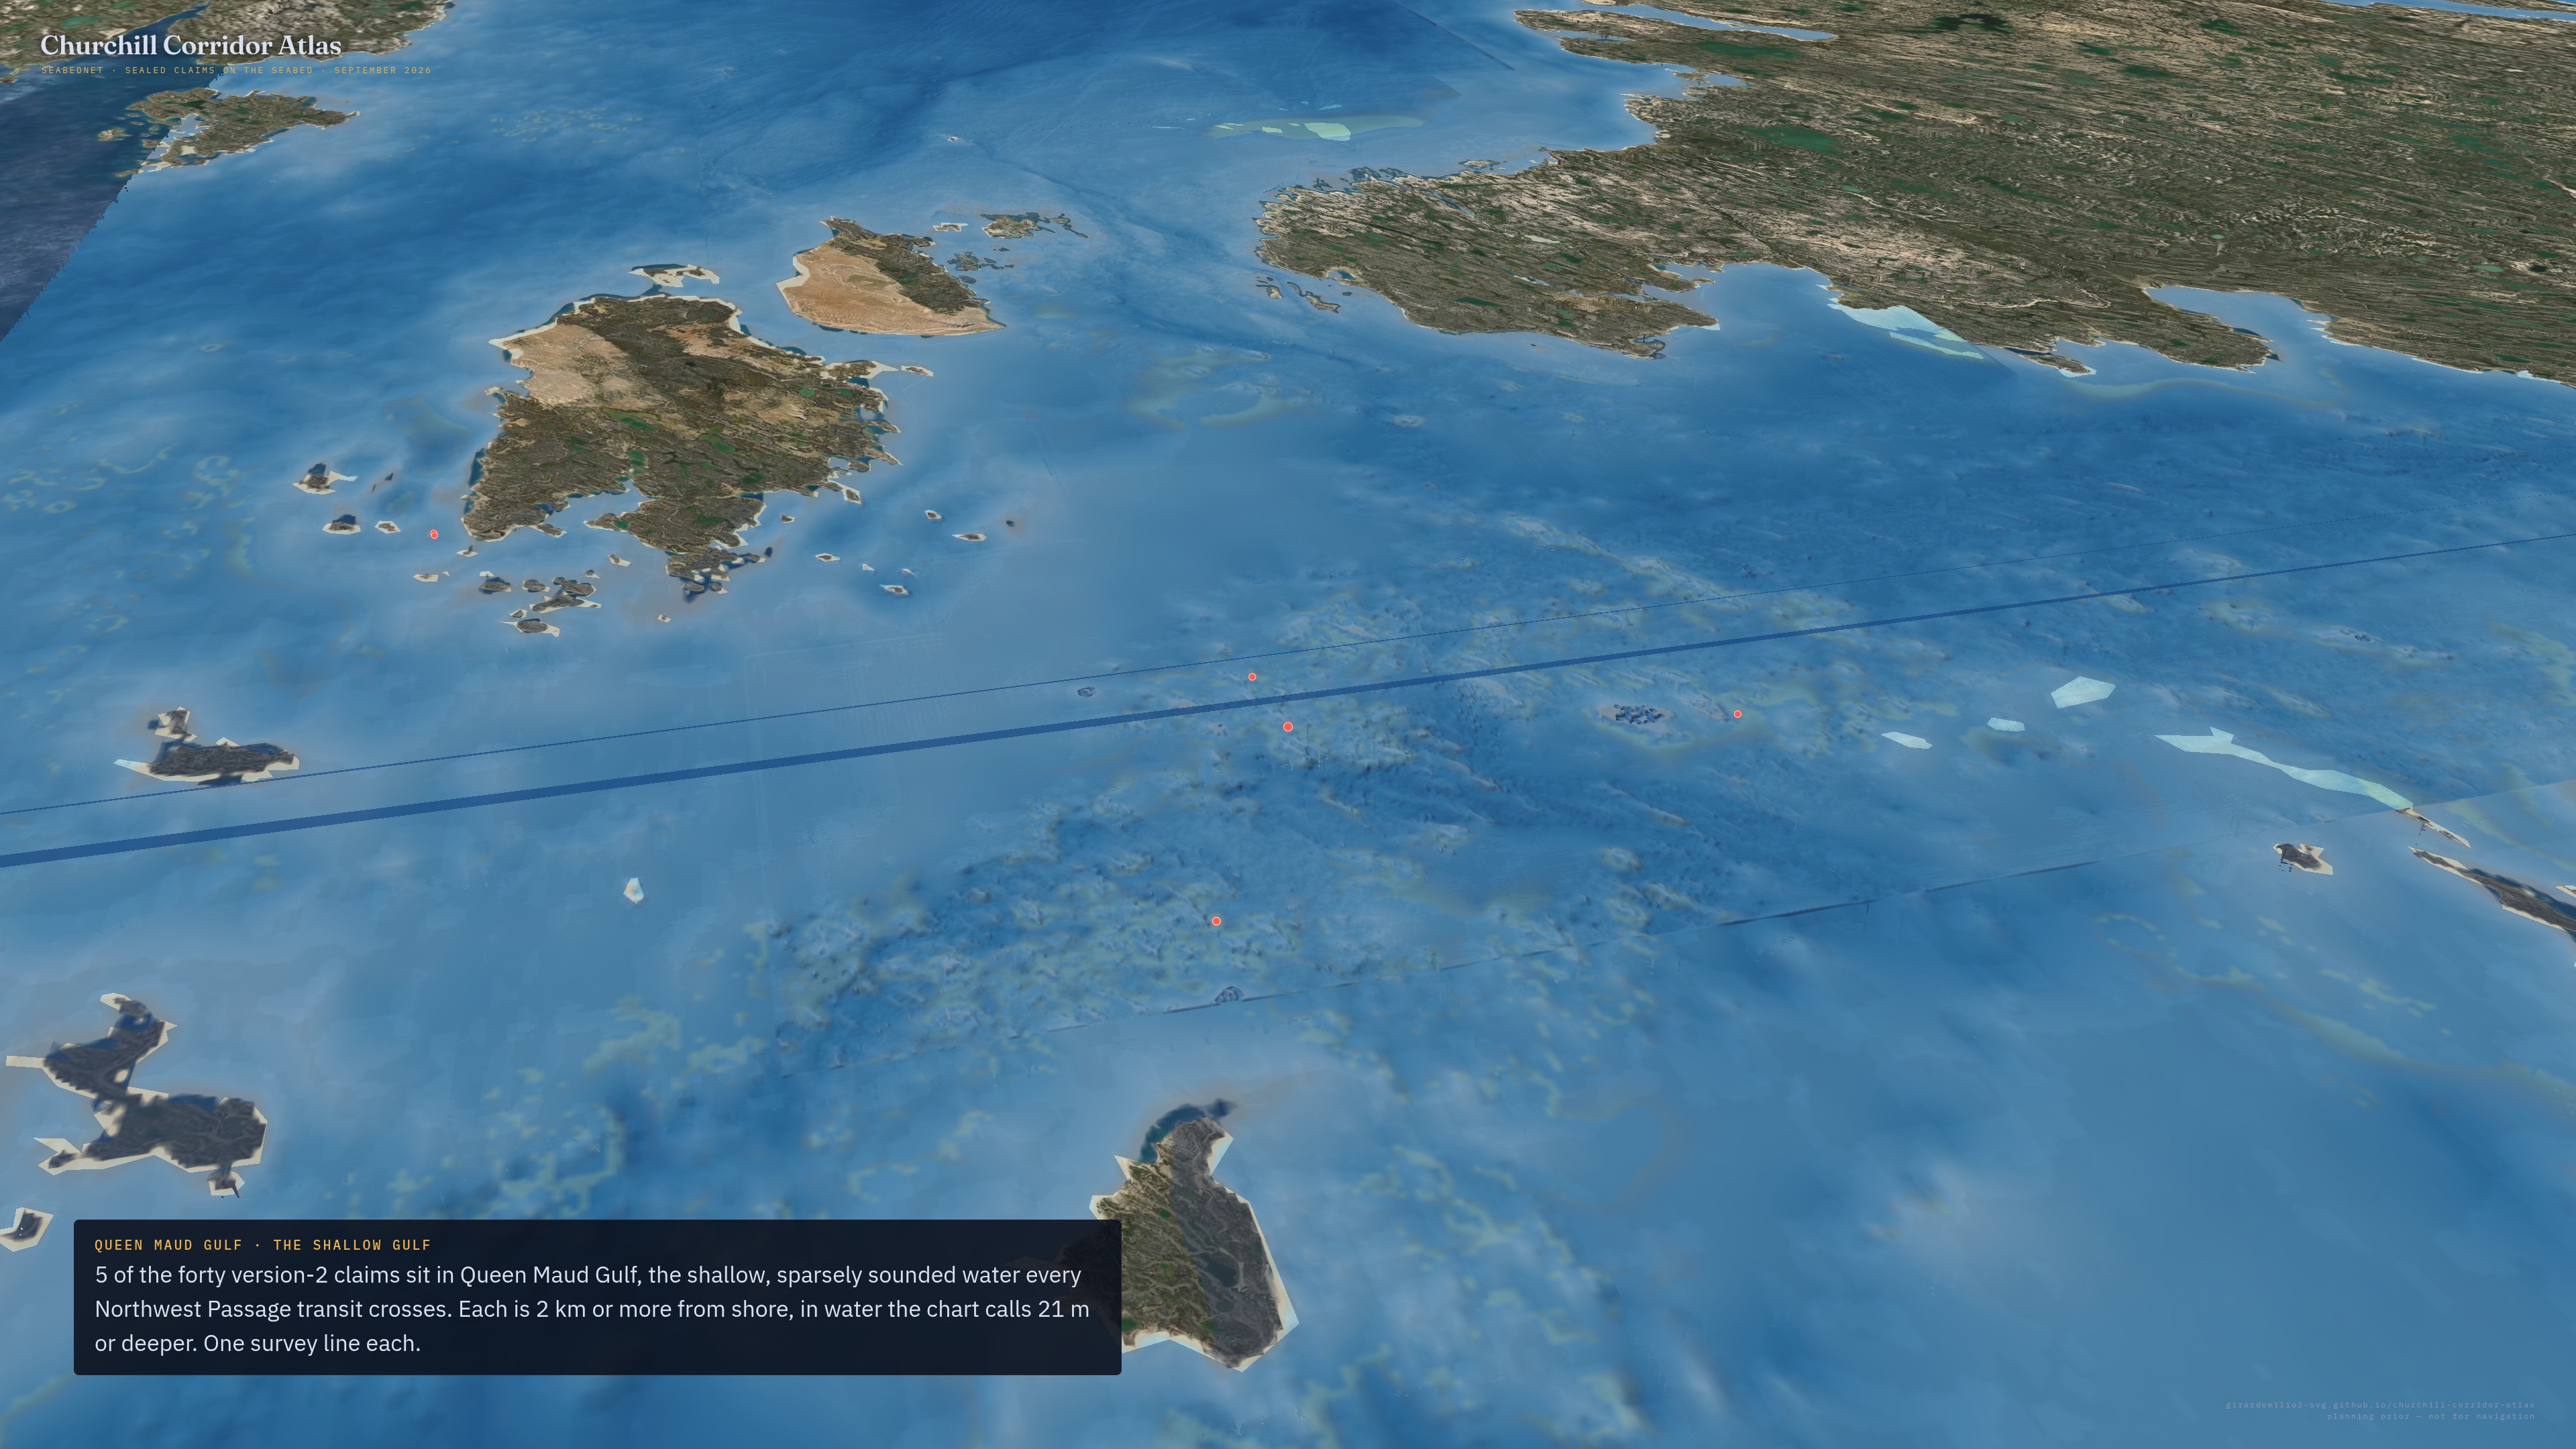
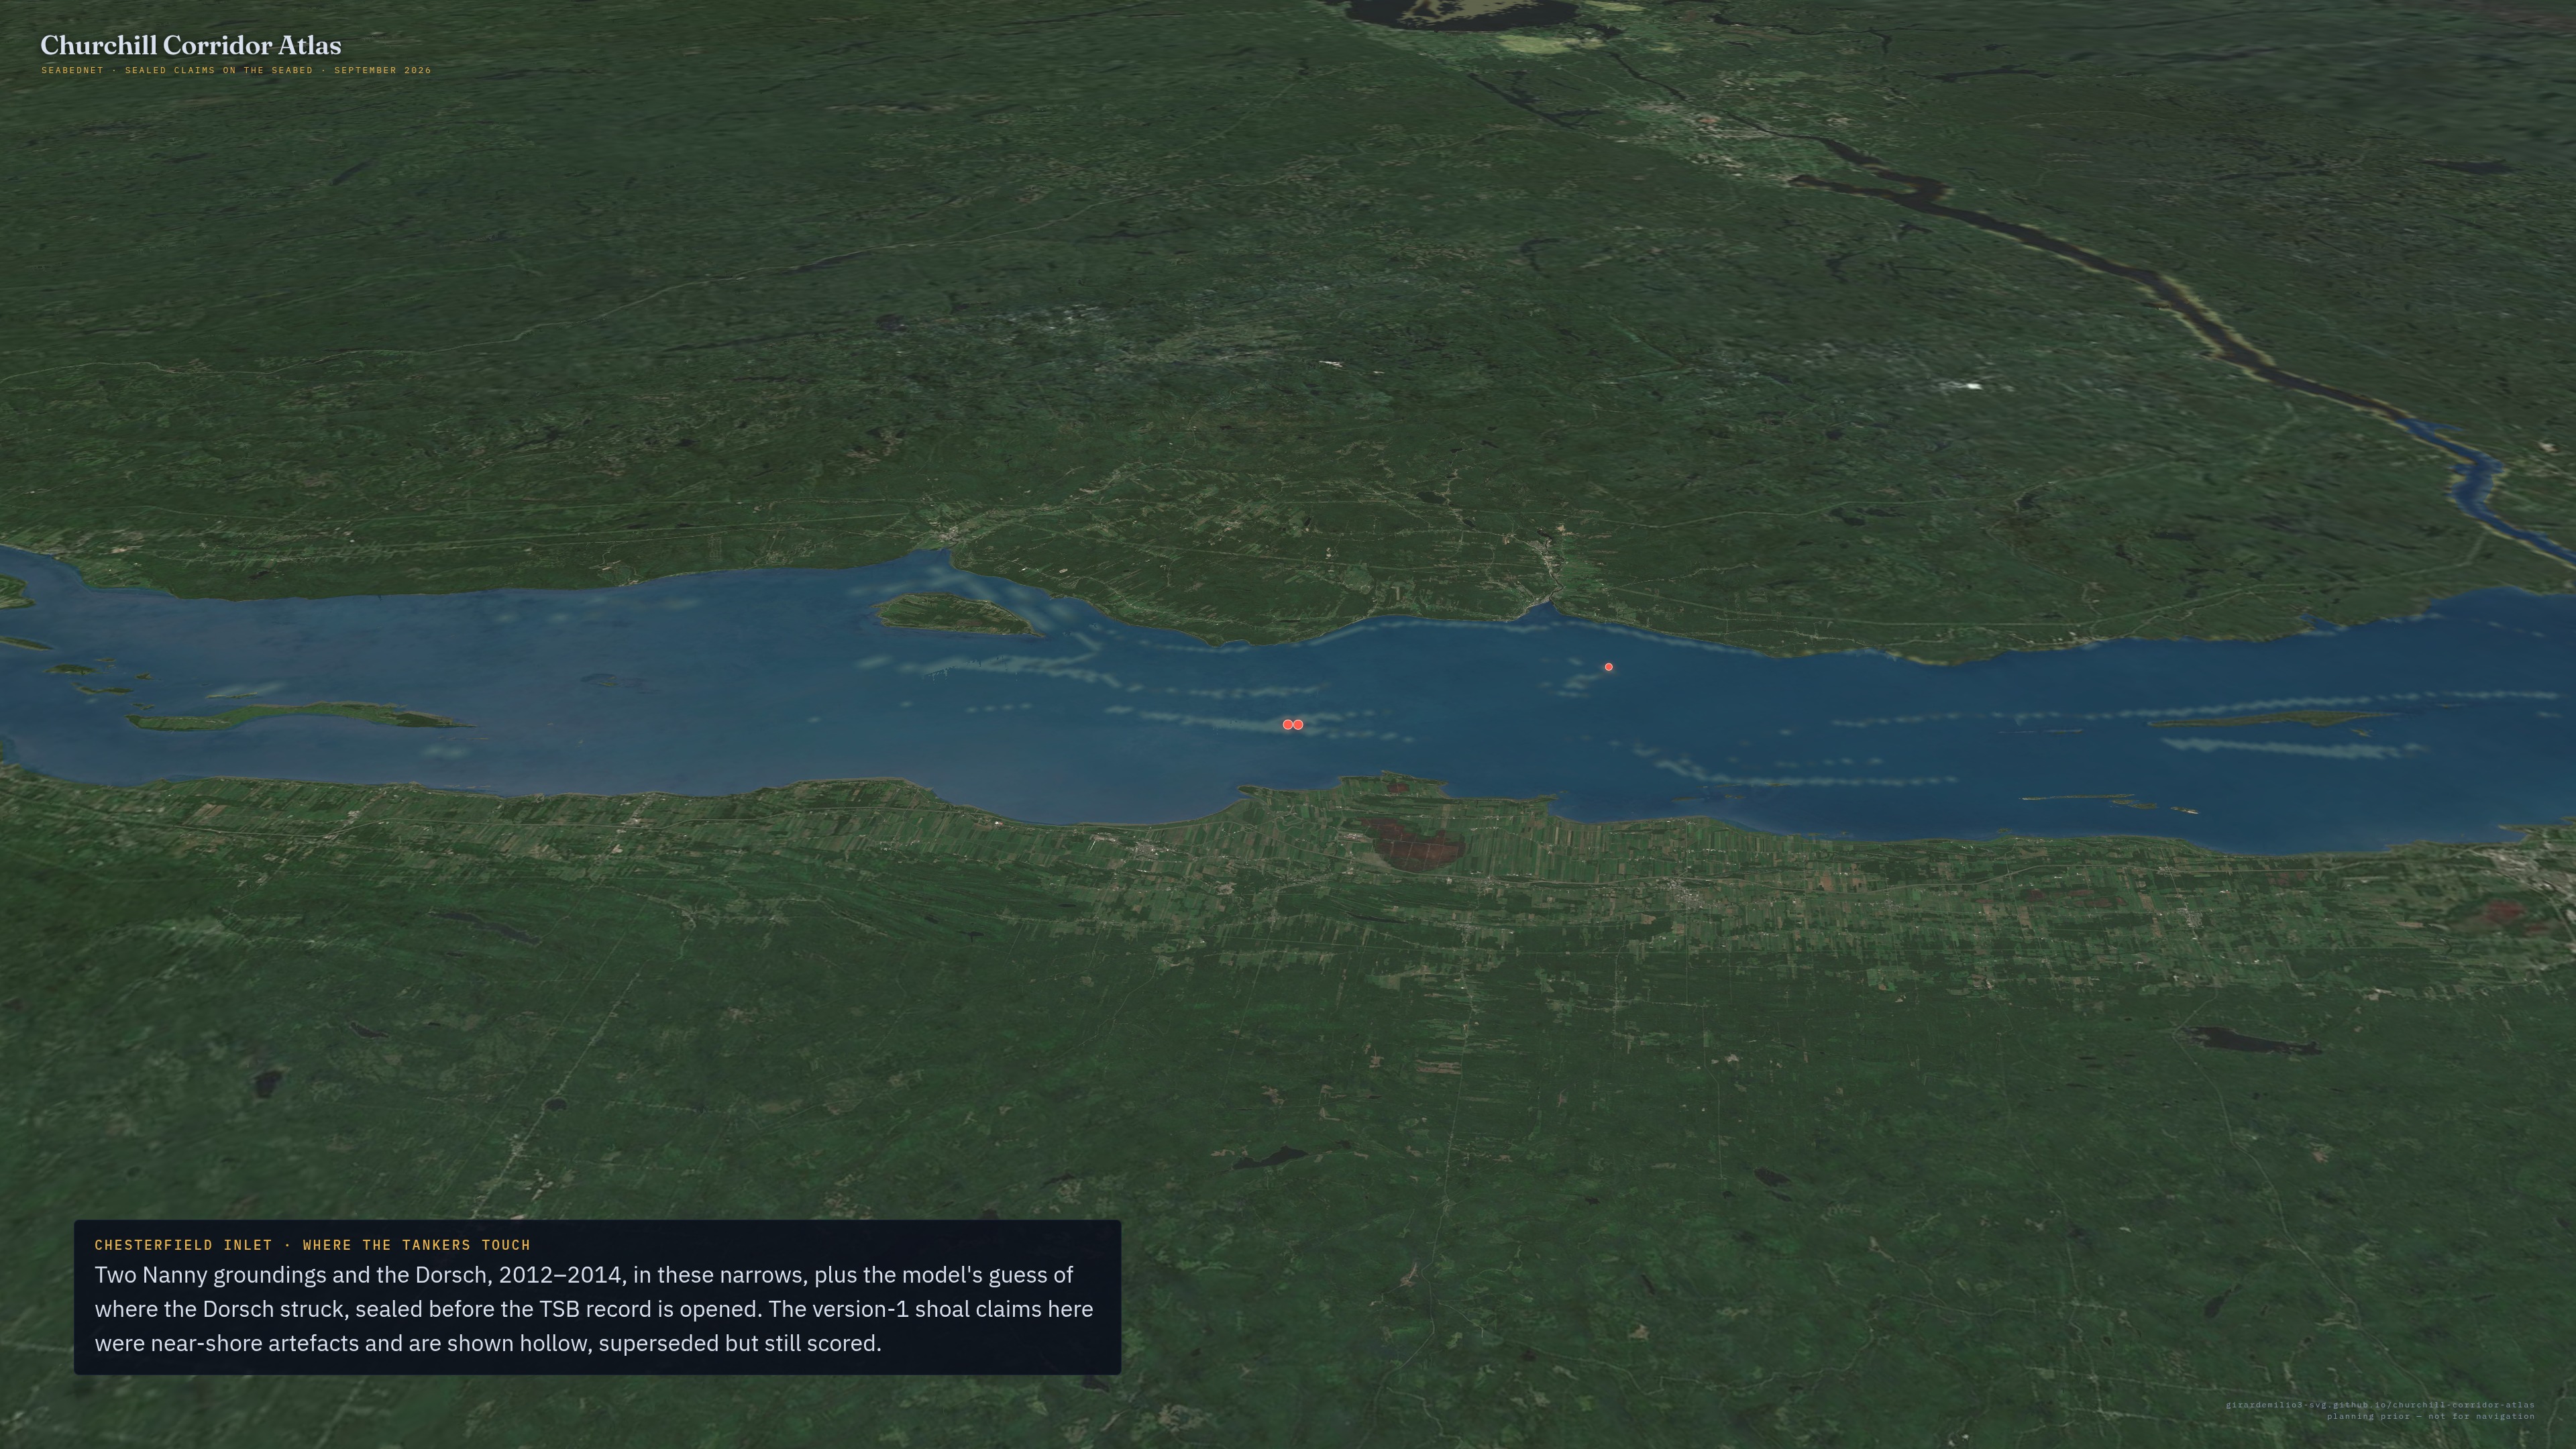
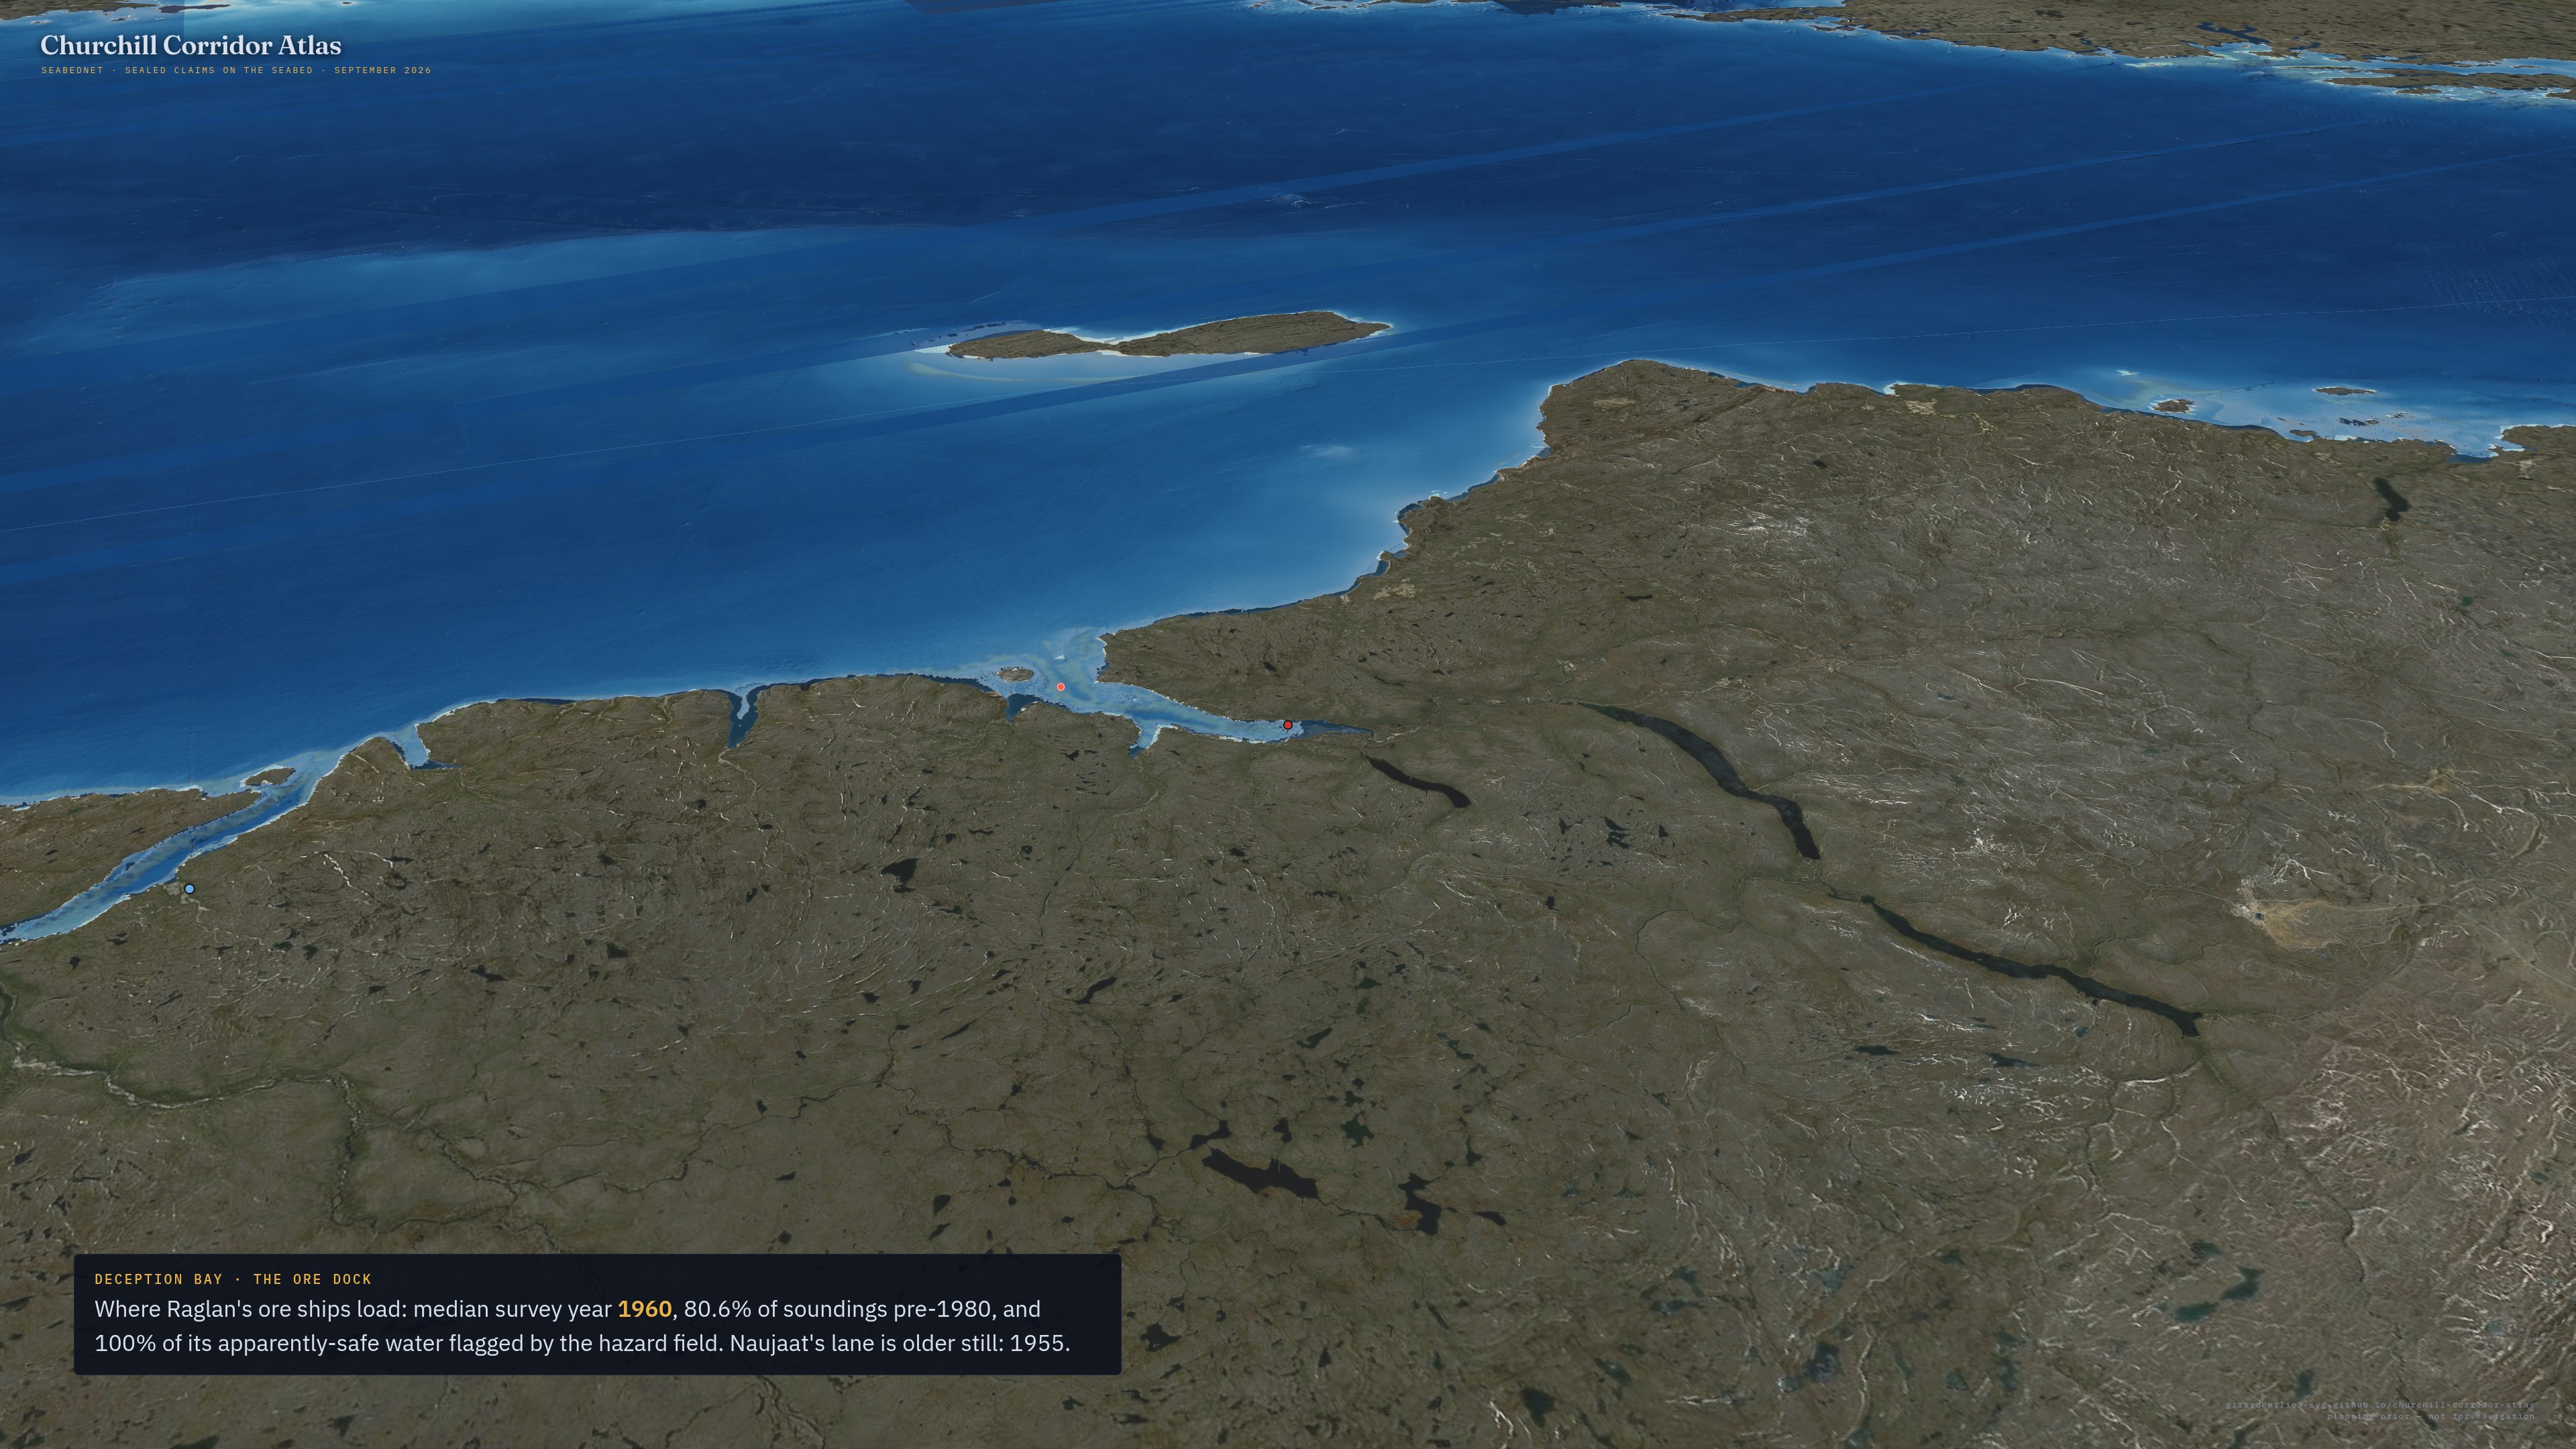
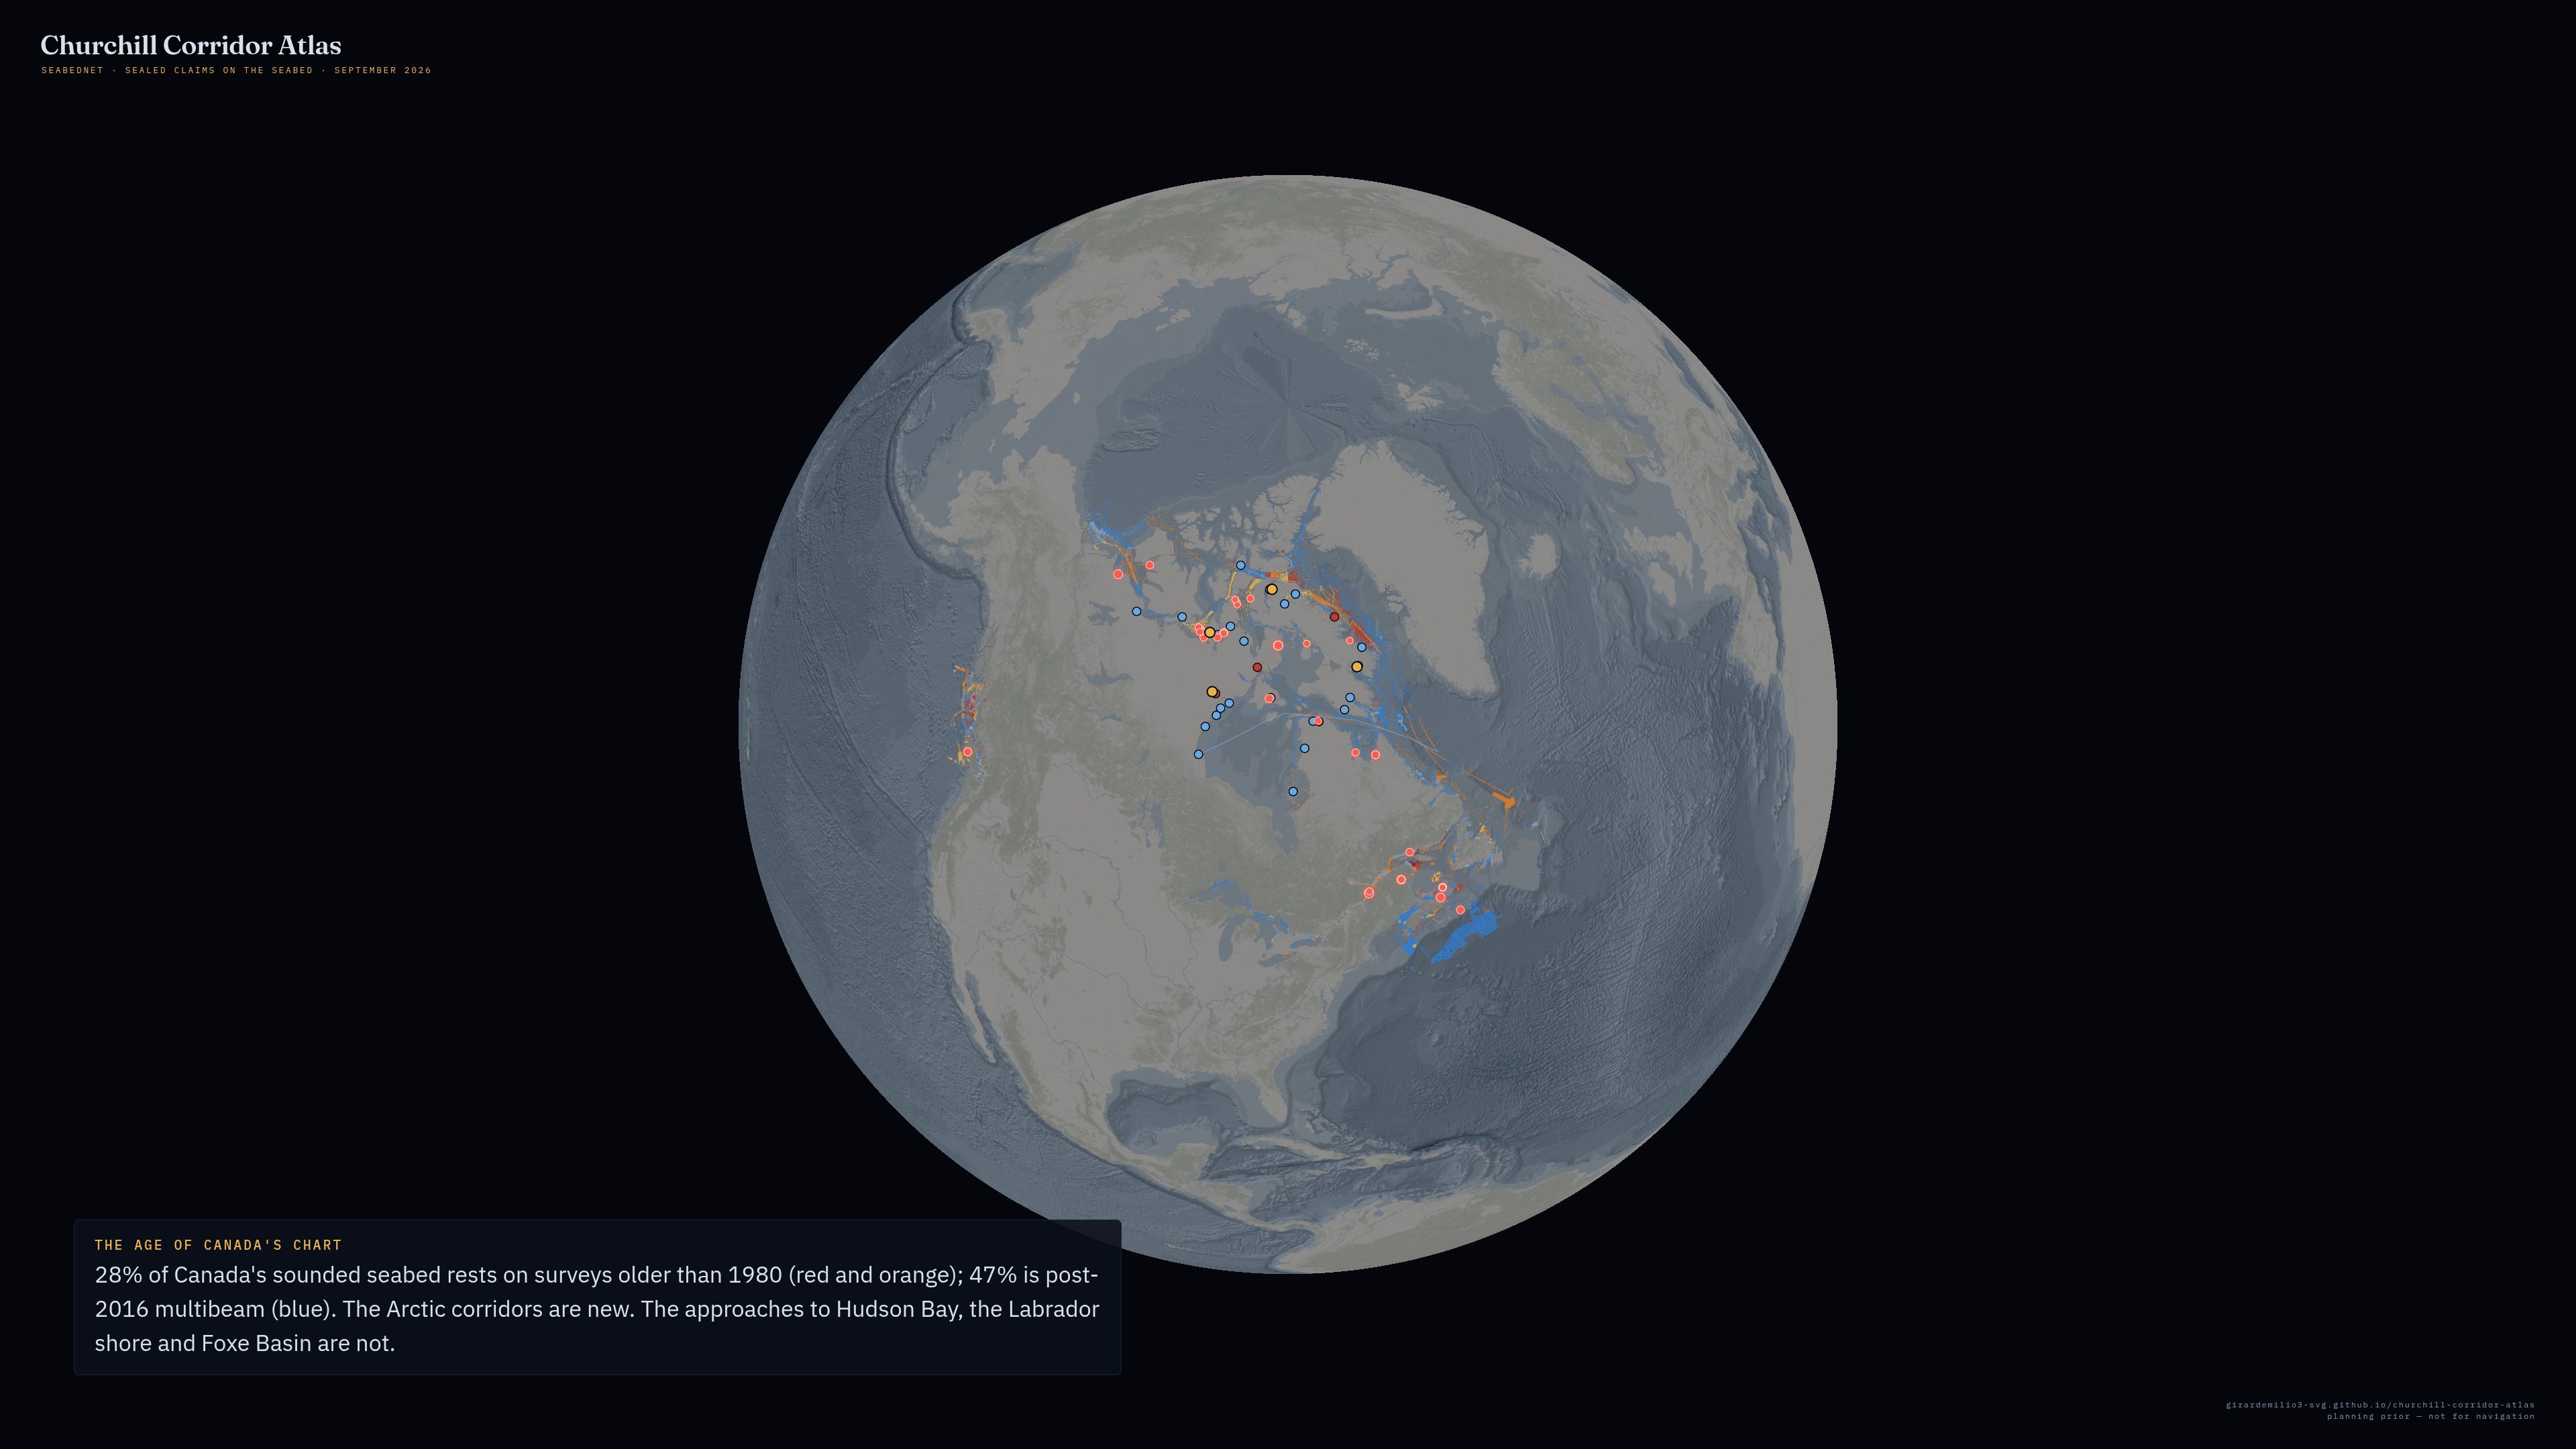
Exhibit Mthe accuracy sprint
What moved the number, what did not, and where a ship would find the most rock per day
The temporal benchmark, before and after new inputs
Same test as Exhibit H: a model that has seen only pre-2016 soundings predicts the post-2016 soundings in the corridor. The control row is the original model fine-tuned for the same number of steps with the same inputs, so that any change in the next rows is the inputs and not the extra training. From-scratch rows share one recipe within each size. Two things came out of it. Winter Sentinel-1 radar is the only input that helps, and it helps most in the 0–50 m band where ships ground; at full size it also adds a deep-water bias that costs it the overall number, so the current best overall model is the full-size from-scratch control at 13.18 m with a 20–50 m error of 14.9 m against the published 17.9 m. And swapping the gravity anchor for one that has never seen a ship sounding costs about a metre: that row is the leakage-free number to defend in review.
| Model | MAE (m) | nearest sounding | gravity prior | inside 1σ | 0–20 m | 20–50 m | bias |
|---|---|---|---|---|---|---|---|
| Original (soundings + gravity), 34.8M | 13.26 | 18.85 | 18.08 | 74% | 15.31 | 17.85 | +0.4 |
| Control fine-tune (same inputs) | 12.67 | 18.85 | 18.08 | 68% | 13.65 | 17.16 | +1.4 |
| Fine-tune + coastal elevation + Sentinel-2 | 13.18 | 18.85 | 18.08 | 67% | 17.97 | 19.20 | +1.9 |
| From scratch, 6.8M: soundings + gravity | 14.57 | 18.85 | 18.08 | 70% | 16.25 | 24.48 | -1.4 |
| From scratch: + coastal elevation + Sentinel-2 | 14.83 | 18.85 | 18.08 | 66% | 22.15 | 24.42 | +1.5 |
| From scratch: + winter Sentinel-1 radar | 13.88 | 18.85 | 18.08 | 68% | 15.76 | 17.29 | -0.8 |
| From scratch: + winter radar, full coverage | 13.54 | 18.85 | 18.08 | 66% | 14.45 | 16.38 | +2.8 |
| From scratch: + raw gravity, leakage-free anchor | 15.48 | 18.85 | 26.52 | 69% | 20.86 | 21.62 | -0.8 |
| Full size, full corpus, from scratch: control | 13.18 | 18.85 | 18.08 | 69% | 14.60 | 14.89 | +1.5 |
| Full size, full corpus, from scratch: + winter radar | 14.03 | 18.85 | 18.08 | 61% | 13.04 | 15.12 | +4.7 |
| Full size control + 4-fold test-time augmentation | 12.89 | 18.85 | 18.08 | 71% | 13.99 | 14.44 | +1.5 |
| Full size + winter radar + 8-fold augmentation | 13.80 | 18.85 | 18.08 | 62% | 12.60 | 15.00 | +4.6 |
| Ensemble of three full-size models (v6 map) | 12.83 | 18.85 | 18.08 | 72% | 13.60 | 15.20 | +2.2 |
| Ensemble + nearest-sounding blend inside 1 km (fit on half the blocks, scored on the other half) | 12.45 | 18.85 | 18.08 | 74% | 12.90 | 14.88 | +1.8 |
The corridor map layer is now the six-member map. Six full-data models (the published one, two retrains, three seeds) each run with four-fold test-time augmentation, averaged, then blended with the nearest sounding by distance. Its held-out proxy is the three-member augmented ensemble with the same blend, 12.45 m on the temporal benchmark against 13.3 m for the published map; the six-member map itself cannot be scored there because its members saw every year of soundings. On the ship soundings of Exhibit O it scores a median error of 3.4 m and 81% within 10 m at shelf cells with no charted sounding, against 4.9 m and 70% for the unblended three-member map. File csb_shelf_stats_v6h.json.
The hazard head with winter radar, on the Coast Guard tests
The version-2 hazard head was fine-tuned twice from the same checkpoint for the same number of steps, once with the winter Sentinel-1 channel and once without, and the radar version was run over all 437 blocks. Reported dangers in the top decile of apparently-safe water within 25 km (Exhibit L protocol), on the notices in force and on the archive:
| Notices in force | n | v2 head | v2 + radar | nearest-sounding rule |
|---|---|---|---|---|
| chart says safe | 107 | 36 (34%) | 37 (35%) | 40 (37%) |
| + blind (no sounding within 300 m) | 37 | 10 (27%) | 9 (24%) | 7 (19%) |
| Arctic, chart safe | 40 | 11 (28%) | 11 (28%) | 9 (22%) |
| stated depth <=21 m, chart safe | 13 | 8 (62%) | 8 (62%) | 5 (38%) |
| Reported/Shoal/Uncharted only, chart safe | 60 | 23 (38%) | 24 (40%) | 23 (38%) |
| Archive 2017–2026 | n | v2 head | v2 + radar | nearest-sounding rule |
|---|---|---|---|---|
| chart says safe | 1373 | 682 (50%) | 674 (49%) | 662 (48%) |
| + blind (no sounding within 300 m) | 124 | 39 (31%) | 44 (35%) | 37 (30%) |
| Arctic, chart safe | 119 | 28 (24%) | 30 (25%) | 56 (47%) |
| stated depth <=21 m, chart safe | 129 | 61 (47%) | 62 (48%) | 91 (71%) |
| Reported/Shoal/Uncharted only, chart safe | 285 | 116 (41%) | 121 (42%) | 157 (55%) |
Radar improves the depth model (above) but, fine-tuned into the hazard head, changes the reported-danger scores by a point or two either way. The head still trails the nearest-sounding rule in the Arctic and on notices with a measured depth. A hazard head trained from scratch with radar is the next run; if it does not move these numbers, the honest reading is that reported dangers are governed by cues the hazard field does not carry, which is what the danger-report model below already exploits.
The reported-dangers test at ten times the size
The Coast Guard also keeps its cancelled notices. All 8,948 danger positions from 2017–2026 (3,302 with a measured depth, 385 Arctic) scored with the Exhibit L protocol. At this size the picture is plainer than on the live set: the hazard head and the “danger is where the nearest sounding is shallow” rule tie where the chart calls the water safe, and the rule wins in the Arctic and on notices with a measured depth. That is the current limit of the hazard head, stated as measured; the next section is what we are doing about it.
| Subset (archive, chart says safe) | n | v2 head | nearest-sounding rule |
|---|---|---|---|
| chart says safe | 1373 | 682 (50%) | 662 (48%) |
| + no sounding within 300 m (blind) | 124 | 39 (31%) | 37 (30%) |
| + no sounding within 1 km | 66 | 11 (17%) | 9 (14%) |
| + nearest sounding deeper than 21 m | 1298 | 644 (50%) | 603 (46%) |
| Arctic, chart safe | 119 | 28 (24%) | 56 (47%) |
| stated depth <=21 m, chart safe | 129 | 61 (47%) | 91 (71%) |
| Reported/Shoal/Uncharted Rock only, chart safe | 285 | 116 (41%) | 157 (55%) |
Where dangers get reported: a model tested on years it never saw
Every reported danger from the live and archived notices with a date, in water the chart calls safe, against ten random chart-safe cells per notice from the same blocks. Trained on notices up to 2022, tested on 2023–2026 (39,050 cells, 692 reported dangers, base rate 1.8%). The question is the one a survey planner asks: of the water the chart calls safe, which tenth will produce the reports?
| Ranking | AUC | Top decile precision | Top decile recall |
|---|---|---|---|
| All cues (hazard field, soundings, coast, elevation, imagery, radar, gravity) | 0.932 | 14.6% | 82% |
| All cues except the hazard field | 0.931 | 14.4% | 81% |
| Hazard field only (learned) | 0.857 | 10.7% | 61% |
| Nearest sounding only (learned) | 0.846 | 9.9% | 56% |
| Hazard probability, raw rank | 0.741 | 3.0% | 17% |
| Nearest sounding depth, raw rank | 0.724 | 2.8% | 16% |
Read it straight. The combined ranking puts 82% of the next four years’ reported dangers in a tenth of the safe water, 8× the base rate. The hazard field on its own is only slightly better than the nearest-sounding rule, and adds almost nothing once the other cues are in: the biggest cues are distance to the nearest sounding and to the coast, then the predicted shallowest point, coastal elevation, and the imagery and radar channels (drop-one AUC loss: nearest km (+0.015), coast dist px (+0.008), shoal m (+0.004), land max500 (+0.004), s2 r (+0.003), s1 vv (+0.003)). Two of those, distance to soundings and to the coast, are partly measures of where ships go rather than of the seabed, so this is a model of reporting as much as of rock. For deciding where to send a survey launch that is the right target; for a scientific claim about the seabed it is not, and we say so.
Second pass, richer cues. Adding the satellite-bathymetry index (log blue/green), radar texture, seabed roughness and slope, the distance to the nearest shallow sounding and the mean hazard within 1 km lifts the combined ranking to AUC 0.942, 83% of later reported dangers in the top decile. For the Arctic alone (1,377 test cells, 105 reported dangers, base rate 7.6%): the top decile of chart-safe water holds 45% reported dangers, 6× the base rate, capturing 58% of them. With the exposure cues removed entirely (distance to soundings, to shallow soundings, to the coast, latitude) the ranking still reaches AUC 0.909 and 77% recall, so the seabed cues carry real signal of their own. Predicted probabilities are conservative: the top decile is predicted at 10% and observed at 15%.
Measured depths at reported shoals
3,488 notices state a least depth. Where the chart called the water safe (197 positions, reported depth median 14 m against a chart of 21 m or more), the hazard head’s predicted shallowest point is unbiased (-1.1 m) where the nearest sounding is biased +19 m deep, but no more precise: mean error 19 m against 19 m, within 5 m in 34% of cases against 31%. In the Arctic (291 positions): model 10.9 m, nearest sounding 8.6 m, chart bias +6.7 m. The head knows the chart is too deep; it does not yet know by how much.
The laser, again: a null result on the claims
Raw ICESat-2 photons (all confidence levels, 2019–2026) were pulled in a 1.2 km box around each of the forty version-2 claims and searched, pass by pass, for a bottom return below the sea-surface peak. A detector that finds “bottoms” on 30 of 36 claims also finds them over 800 m of water in Lancaster Sound (11 of 38 passes) and on the Beaufort slope (19 of 30), at the same depths: the 4 m peak is the instrument’s afterpulse and the deeper ones are subsurface scattering and sea ice. The claim check is therefore inconclusive and is not used as evidence for or against any claim. The photon subsets and both detectors are in the repository for anyone who can do better.
The survey plan, ranked by what a ship would find
Exhibit K ranks survey boxes by uncertainty. This ranks them by the expected area of keel-depth hazard a survey would uncover per ship-day: the sum of P(shallowest point within 500 m < 10.5 m) over cells the chart calls navigable that no published sounding has touched, restricted to water ships use (within 30 km of the Churchill route or an NRCan Canadian shipping route / Arctic sea route, or 15 km of a sealift community; blocks where the gravity prior fails (inland lakes) excluded). Twenty boxes, 1,972 km², 49 ship-days, C$5–9M, expected hazard area 490 km². This is the number a hydrographic service can act on: hazards found per day at sea.
| Box | Area (km²) | Expected hazard (km²) | Ship-days | Hazard km² per ship-day |
|---|---|---|---|---|
| 56.0°N 79.5°W | 30 | 11.5 | 1 | 15.3 |
| 62.0°N 66.5°W | 73 | 24.2 | 2 | 13.3 |
| 62.5°N 67.0°W | 60 | 19.0 | 2 | 12.7 |
| 68.5°N 101.0°W | 64 | 19.5 | 2 | 12.2 |
| 62.0°N 93.0°W | 54 | 15.3 | 1 | 11.3 |
| 68.5°N 96.0°W | 28 | 7.7 | 1 | 11.0 |
| 63.5°N 68.0°W | 69 | 18.9 | 2 | 10.9 |
| 69.0°N 82.5°W | 36 | 9.6 | 1 | 10.6 |
| 69.0°N 82.0°W | 43 | 11.3 | 1 | 10.4 |
| 63.0°N 67.5°W | 96 | 24.5 | 2 | 10.2 |
| 63.0°N 68.0°W | 283 | 69.7 | 7 | 9.9 |
| 67.5°N 114.0°W | 107 | 26.2 | 3 | 9.8 |
First 12 of 20; file national_plan_v2.json.
The same plan, ranked by the danger-report model
The validated model above applied to every chart-safe cell in shipping water on a 500 m grid, and the boxes ranked by expected reported-danger area per ship-day. Twenty boxes, 4,973 km², 124 ship-days, C$13–23M. Where the two rankings agree, the case is strong; where they differ, the hazard-only ranking is the physical claim and this one is the operational one.
| Box | Area (km²) | Expected reported-danger area (km²) | Ship-days | per ship-day |
|---|---|---|---|---|
| 64.0°N 83.5°W | 118 | 26.7 | 3 | 9.08 |
| 64.5°N 78.5°W | 55 | 8.0 | 1 | 5.77 |
| 69.0°N 94.0°W | 31 | 4.3 | 1 | 5.51 |
| 63.5°N 92.0°W | 58 | 6.8 | 2 | 4.70 |
| 62.5°N 65.5°W | 138 | 14.6 | 3 | 4.25 |
| 63.5°N 69.0°W | 175 | 16.5 | 4 | 3.77 |
| 63.0°N 91.0°W | 289 | 24.1 | 7 | 3.33 |
| 65.5°N 59.0°W | 90 | 6.1 | 2 | 2.73 |
| 63.5°N 91.5°W | 143 | 9.4 | 4 | 2.61 |
| 62.5°N 91.5°W | 580 | 37.5 | 14 | 2.58 |
| 65.5°N 58.5°W | 268 | 16.8 | 7 | 2.51 |
| 62.5°N 92.5°W | 75 | 4.6 | 2 | 2.47 |
File national_plan_v3.json.
Hazard heads trained from scratch
One more attempt at the hazard field, with and without winter radar, trained from scratch for 3,000 steps on the same recipe instead of warm-started from the published head. Neither beats the published head on the Coast Guard notices. Share of chart-safe notices landing in the top decile of the field, live set then archive: published 34% / 50%; from scratch 32% / 47%; from scratch with radar 36% / 47%. On the blind subset (no sounding within 300 m) the radar head is worse: 19% against 27% live. The hazard field has reached the ceiling of what the soundings support; the danger-report model above is where the operational signal is.
Laser altimetry, second pass. NASA's official ICESat-2 bathymetry product returns no photons anywhere in these waters (its search mask excludes them), so the raw photon data over all 36 claims were re-analysed with an along-track detector that requires a continuous bottom over 60 m, a gap between the surface and the bottom, and a Poisson test against each pass's own deep-water noise, with the detector echo at 3–5 m discarded. On 69 passes over two deep-water control sites it found no bottom at all, so it does not invent shoals. Over the claims it found a bottom on 1 of 36 sites, on a single pass each, none confirmed by a second pass. The honest reading is unchanged: in ice-affected Arctic water the laser cannot see 3–7 m shoals often enough to confirm or refute them, and the claims stand or fall with the next survey release. File is2_v2.json.
Exhibit Nthe prospective test
A forecast sealed before the outcome, scored by the Coast Guard's own notices
Every test so far is a hindcast: soundings we already had were hidden and recovered. This one is not. On 2026-09-12 the danger-report model's score for every chart-safe cell in the Arctic and Hudson Bay corridors (8,851,961 cells over 191 blocks at 500 m spacing: chart-safe water within 30 km of a Natural Resources Canada shipping route or node, or 15 km of a community) was written to a file, hashed and timestamped. Nothing in it can be changed. Every Coast Guard danger notice issued after that date (shallow depth confirmed or reported, shoal, uncharted rock, submerged object) with a position inside the forecast area scores it, under a rule that was fixed at sealing time and written into the file's manifest.
| File | Sealed | Last notice id seen | Cells | SHA-256 | Proof |
|---|---|---|---|---|---|
| Arctic and Hudson Bay corridors | 2026-09-12 | 185304 | 8,851,961 | d57eb0fb858ec6cbce9ec12fd3482b1a14e354a637506ed5df7e4f677b4aef61 | OpenTimestamps .ots |
| Atlantic, Gulf and Pacific coasts (south of 56°N) | 2026-09-13 | 185317 | 4,634,780 | afe70e97fbdf75d4547a2bc73013671ddeff648926bcf232ad373bf0036ee369 | OpenTimestamps .ots |
The second file, sealed a day later under the same rule, covers every chart-safe cell of the southern blocks (68 blocks, no route filter, inland rivers and lakes excluded because the gravity anchor does not apply there). It exists to make the test resolve faster: the Arctic produces ten to twenty danger notices between freeze-up and spring, the southern coasts about fifteen a month inside this coverage. Most southern notices fall in the St. Lawrence River and the Great Lakes, which are outside both files and do not count either way.
The rule. notice eligible iff id > cutoff_id and date > sealed; inside iff a scored cell within 1 km; hit iff nearest cell percentile >= 90 (chance 10%) / >= 99 (chance 1%). Success is a share of notices in the top decile well above one in ten; the Wilson 95% interval is reported with it. Last season the same window (12 September to 30 November) produced 19 danger notices at these latitudes, so the first Arctic reading will be coarse and the test keeps accumulating through the 2027 season. Manifest forecast_danger_2026-09-12.json; the full cell file (485 MB) is available on request and reproduces the hash.
Score as of 2026-10-17
| Notices after the seal inside the forecast | in the top decile (chance 10%) | 95% interval | in the top percentile (chance 1%) | median percentile |
|---|---|---|---|---|
| 2 | 0 (0%) | 0–66% | 0 (0%) | 85.3 |
A notice with several positions counts once, by its best-scored position. Notices outside the forecast area (the St. Lawrence, the Maritimes, the Pacific coast) do not count either way. As of 17 October the Arctic file has its first two notices, both shallow depths confirmed near Kimmirut on 27 and 28 September. They landed at the 90th percentile (89.97, just under the line) and the 81st: both misses under the rule, and reported as misses. File prospective_score_2026-09-12.json.
Southern file, score as of 2026-10-17
| Notices after the seal inside the forecast | in the top decile (chance 10%) | 95% interval | in the top percentile (chance 1%) | median percentile |
|---|---|---|---|---|
| 13 | 12 (92%) | 67–99% | 11 (85%) | 99.8 |
Read this carefully before repeating it (as of 17 October). Ten of the thirteen notices are one survey campaign in Chedabucto Bay, Nova Scotia, nine of them issued on 17 and 18 September, four days after the seal put that bay in the top 1% of the country. That is one event, not ten. And the bay is not new to the Coast Guard: it produced 132 danger notices between 2019 and 2025, all of which the model saw in training, so this is a hit on a recurring area, not the discovery of an unknown one. The other three are separate places. A submerged object reported on 8 October near the Strait of Canso, about 35 km from the bay, sits in the top 1%; it is close enough to Chedabucto that it should not be counted as fully independent. An uncharted rock reported on the central BC coast on 26 September landed at the 92nd percentile: in the top 10%, not the top 1%, and the first hit far from any earlier one. A shallow-depth notice in the St. Lawrence estuary landed at the 47th percentile: a miss. Counted by place, that is three hits in the top 10% (one of them weak because it neighbours the first) and one miss. The interval above treats notices as independent and therefore overstates the evidence; the test keeps accumulating. File prospective_score_2026-09-13.json.
Exhibit Oships of opportunity
Independent soundings nobody trained on: what cruise ships and yachts measured where the map had no sounding
The International Hydrographic Organization pools depth readings that ordinary vessels log while sailing. Every ping uploaded in 2026 was pulled (430,464 map cells with no charted sounding received at least three pings). The readings are raw, so each vessel was first checked against charted soundings and kept only if it agreed to within a few metres, with its draft offset removed: 44 of 82 vessels passed, and on charted cells their readings then sit 1.6 m from the chart. Cells where a vessel reported under 20 m over water a nearby survey measured at more than 100 m were dropped as sounder dropouts. What remains is 278,898 shelf cells (0–200 m) on the Pacific and Atlantic coasts. There is no Arctic in this pool yet: sealift and Arctic cruise operators do not contribute.
| Cells | n | Model: median error / within 10 m | Nearest sounding | Blend |
|---|---|---|---|---|
| All shelf cells | 278898 | 4.9 / 70% | 3.2 / 83% | 3.3 / 81% |
| 0-0.25 km from a sounding | 133196 | 4.3 / 75% | 2.5 / 94% | 2.5 / 94% |
| 0.25-0.5 km from a sounding | 68247 | 4.7 / 71% | 3.0 / 91% | 3.7 / 82% |
| 0.5-1 km from a sounding | 38776 | 5.5 / 64% | 3.8 / 85% | 5.0 / 67% |
| 1-3 km from a sounding | 13774 | 6.3 / 64% | 8.3 / 56% | 6.4 / 64% |
| 3-6 km from a sounding | 6715 | 8.1 / 56% | 25.3 / 34% | 8.5 / 54% |
| 0-20 m deep | 13252 | 7.0 / 59% | 3.5 / 77% | 4.1 / 69% |
| 20-50 m deep | 48831 | 4.3 / 72% | 2.7 / 85% | 2.9 / 83% |
| 50-200 m deep | 216814 | 4.9 / 70% | 3.3 / 83% | 3.4 / 82% |
| BC | 147117 | 4.6 / 75% | 3.4 / 77% | 3.2 / 83% |
| Atlantic | 79082 | 3.1 / 89% | 3.1 / 91% | 3.0 / 92% |
Two honest things. First, most of these cells sit within a kilometre of a charted sounding, because ships sail where surveys exist, and there the nearest sounding beats the model; the model only pulls ahead beyond a kilometre, where the corridor claims live. Second, that is a defect of the published map and it is now fixed: the blend column applies the distance weighting from Exhibit M (fitted on the Arctic benchmark, not on these cells) and matches the better of the two everywhere. File csb_shelf_stats.json.
Ships against the claims
The same ship soundings were run against every hazard candidate and every sealed claim. One sealed claim is refuted: the St. Lawrence estuary claim at 47.633°N 70.046°W predicted a 3 m shoal where the chart reads about 30 m; 613 ship soundings within 300 m read 27.2–36.7 m. It is wrong and stays on the sealed list marked as such. The other 39 sealed claims are in Arctic water with no ship traffic and remain untested. Of 15,936 unsealed hazard candidates, 217 have at least five ship soundings within 300 m: 196 are refuted, 16 ambiguous, and none is a confirmed offshore shoal once bad loggers and coastal shallows are removed. Two honest readings follow. The hazard field over-predicts in charted, busy southern waters, which is where ships can check it; and ships choose safe water, so a sounding 300 m away does not rule out a narrow pinnacle. File candidates_vs_csb_summary.json.
Exhibit Jsealed claims
Forty places we say hide a keel-depth shoal, and four groundings we place before the record does
A validated model earns the right to make claims. These are the model’s, sealed on 2026-09-03 with SHA-256 and OpenTimestamps so they cannot be edited after the fact, and written so that a single survey line settles each one.
The Shoal List, version 2 (sealed 2026-09-06)
A correction, on the record. Three days after sealing version 1 we tested it against things it had never seen: a Sentinel-2 image over every claim, the GSHHG shoreline, and the Coast Guard’s reported-danger notices (Exhibit L). Version 1 failed two of our own checks. Every one of its forty claims predicted a rock at the surface, 22 of 40 sat within a kilometre of a shore, and several lined up along single survey tracks. The hazard head had learned a true but useless fact: near a coast, the shallowest point within 500 m is the beach. Version 1 stays sealed and will be scored exactly as published. It is superseded, not withdrawn.
What changed. The shallowest-point model was retrained on the user’s own hardware with two rules: a training target only counts where at least 95% of the 500 m disc around it carries 10 m soundings (no land, no gaps), and targets at or above the surface are discarded. The candidate filters gained three conditions: at least 2 km from the full-resolution coastline, no cluster confined to a single row or column of cells, and a predicted shallowest point between 3 and 18 m, the depth of a keel-height pinnacle rather than a beach. Of 5,388 candidate clusters nationally, 272 pass; the top 40, at most two per quarter-degree, are sealed. Regions: Queen Maud Gulf (5), Bellot Strait (5), Cape Breton / Sydney Bight (4), Simpson Strait (4), St. Lawrence estuary (3), Ungava Bay (3).
| # | Water | Lat | Lon | P(shoal < 10.5 m) | Predicted shallowest (m) | Map says (m) | km to coast | km to sounding |
|---|---|---|---|---|---|---|---|---|
| 1 | unnamed water near 68.4N 82.2W | 68.4287°N | 82.1649°W | 100% | 3.2 | 26 | 3.2 | 0.0 |
| 2 | St. Lawrence estuary | 47.4786°N | 70.1047°W | 100% | 3.6 | 27 | 6.14 | 0.0 |
| 3 | St. Lawrence estuary | 47.4749°N | 70.1088°W | 100% | 4.1 | 26 | 6.17 | 0.0 |
| 4 | Amundsen Gulf | 69.4077°N | 124.1286°W | 99% | 4.5 | 21 | 5.52 | 0.7 |
| 5 | Cape Breton / Sydney Bight | 45.6842°N | 61.6202°W | 98% | 5.6 | 24 | 2.61 | 0.0 |
| 6 | Queen Maud Gulf | 68.5466°N | 99.8613°W | 97% | 4.3 | 31 | 21.65 | 0.0 |
| 7 | unnamed water near 68.4N 82.2W | 68.4221°N | 82.1553°W | 97% | 6.0 | 28 | 3.82 | 0.0 |
| 8 | unnamed water near 48.1N 65.9W | 48.1018°N | 65.9263°W | 96% | 3.3 | 22 | 6.86 | 0.1 |
| 9 | Vancouver Island west coast | 49.3822°N | 126.3839°W | 96% | 3.0 | 23 | 2.2 | 0.0 |
| 10 | Vancouver Island west coast | 49.3822°N | 126.3812°W | 95% | 3.4 | 23 | 2.19 | 0.0 |
| 11 | Rae Strait / King William Is. | 68.9066°N | 94.6877°W | 94% | 5.5 | 27 | 7.44 | 0.0 |
| 12 | Foxe Channel | 64.0626°N | 83.4895°W | 94% | 3.2 | 21 | 3.93 | 0.1 |
| 13 | Scotian Shelf | 44.0560°N | 59.6559°W | 94% | 3.2 | 31 | 6.98 | 0.1 |
| 14 | Ungava Bay | 58.7715°N | 66.1390°W | 94% | 3.6 | 52 | 2.56 | 0.0 |
| 15 | Amundsen Gulf | 71.6121°N | 119.0456°W | 93% | 3.9 | 22 | 2.52 | 0.6 |
| 16 | Simpson Strait | 68.4251°N | 98.6218°W | 93% | 4.5 | 22 | 3.08 | 0.1 |
| 17 | Cape Breton / Sydney Bight | 46.4905°N | 61.1219°W | 93% | 3.8 | 31 | 3.32 | 0.1 |
| 18 | Mingan / Quebec North Shore | 50.2256°N | 64.1885°W | 92% | 4.0 | 47 | 3.18 | 0.3 |
| 19 | Ungava Bay | 58.7687°N | 66.1404°W | 92% | 3.6 | 42 | 2.29 | 0.1 |
| 20 | Simpson Strait | 68.3988°N | 95.7886°W | 91% | 4.9 | 22 | 5.08 | 0.9 |
First 20 of 40. File shoal_list_v2_2026-09-06.csv · SHA-256 958acbdba593823130560b94116f9dee19b300a3c08a55bf11b6c73e12d43531 · OpenTimestamps proof .ots. A Sentinel-2 summer image was pulled over all forty: every position is open water, none shows a visible rock or breaker at 10 m resolution, which neither confirms nor refutes a 3–7 m shoal. Same scoring rule as version 1.
The Shoal List, version 1 (sealed 2026-09-03, superseded)
Across all 437 NONNA blocks, 626 places pass every filter: the depth map calls the water 21–150 m deep, the shallowest-point model puts a rock between the surface and 21 m within 500 m with probability ≥ 80%, no published sounding within 500 m says otherwise, and the claim sits inside the 6 km inference envelope. The top 40 by probability, at most two per quarter-degree, are sealed. Regions: Strait of Belle Isle (7), Beaufort Sea (6), Hecate Strait (5), Chesterfield Inlet (5), Rae Strait / King William Is. (2), Gulf of St. Lawrence (2). Inland lakes are excluded: the gravity anchor is invalid there.
| # | Water | Lat | Lon | P(shoal < 10.5 m) | Predicted shallowest (m) | Map says (m) | km to sounding |
|---|---|---|---|---|---|---|---|
| 1 | Beaufort Sea | 69.4608°N | 131.6042°W | 100% | 0.4 | 22 | 0.6 |
| 2 | Beaufort Sea | 69.4714°N | 131.8059°W | 100% | 1.0 | 40 | 0.2 |
| 3 | Beaufort Sea | 69.4801°N | 131.7785°W | 100% | -0.2 | 44 | 0.0 |
| 4 | Beaufort Sea | 69.4545°N | 131.9171°W | 100% | 0.9 | 28 | 0.4 |
| 5 | Hecate Strait | 54.1170°N | 132.3797°W | 100% | -0.6 | 26 | 0.3 |
| 6 | Beaufort Sea | 69.4555°N | 131.9144°W | 100% | 0.9 | 26 | 0.3 |
| 7 | Beaufort Sea | 69.4897°N | 131.4696°W | 99% | 0.8 | 25 | 0.7 |
| 8 | Hecate Strait | 54.2063°N | 131.6577°W | 99% | -0.3 | 54 | 0.0 |
| 9 | Hecate Strait | 54.1218°N | 132.3413°W | 99% | 0.2 | 29 | 0.3 |
| 10 | Chesterfield Inlet | 64.0151°N | 94.4667°W | 98% | 0.1 | 24 | 0.1 |
| 11 | Chesterfield Inlet | 64.0668°N | 94.6301°W | 98% | -1.3 | 29 | 0.1 |
| 12 | Strait of Belle Isle | 51.6091°N | 55.9772°W | 98% | -1.6 | 28 | 0.2 |
| 13 | Strait of Belle Isle | 51.5971°N | 56.0060°W | 98% | 0.0 | 31 | 0.1 |
| 14 | Rae Strait / King William Is. | 69.3971°N | 94.2663°W | 98% | 0.7 | 28 | 0.8 |
| 15 | Chesterfield Inlet | 64.1916°N | 94.7989°W | 98% | 0.9 | 29 | 0.1 |
| 16 | Strait of Belle Isle | 51.4166°N | 56.5125°W | 98% | -0.3 | 39 | 0.1 |
| 17 | Hecate Strait | 54.1202°N | 132.3495°W | 98% | -2.0 | 28 | 0.1 |
| 18 | Queen Maud Gulf | 68.4706°N | 100.3335°W | 97% | -2.5 | 22 | 0.6 |
| 19 | unnamed water near 68.5N 82.5W | 68.4771°N | 82.5163°W | 97% | 0.5 | 29 | 0.1 |
| 20 | unnamed water near 68.8N 81.2W | 68.8144°N | 81.2232°W | 97% | -1.2 | 28 | 0.0 |
First 20 of 40. File shoal_list_2026-09-03.csv · SHA-256 a0bc8c3d2c17449116a4cea77e8ee3ab28e1c362b343d17bf851fb61aac404cb · OpenTimestamps proof .ots. Scoring: a survey line over the position finds water shallower than 21 m within 500 m, or it does not; scored per entry, published either way.
Four groundings, placed before the record is opened
Four Arctic groundings are public only as a place name: the TSB has the positions, nobody else does. For each, the hazard model names the cell in the reported area it considers most dangerous for that vessel’s draft, in water the map calls navigable and clear of any charted shore. Sealed 2026-09-03; graded verbatim against the TSB positions when the records request is answered (hit = within 2 km). If they miss, that is published too.
| Grounding | Predicted strike position | P(shoal < draft) | Predicted shallowest (m) | Map says (m) | Cells considered |
|---|---|---|---|---|---|
| Nanny 2010 Simpson Strait, eastern approach, near Gjoa Haven | 68.6442°N 97.7619°W | 100% | 0.7 | 12 | 16,596 |
| Mokami 2010 Pangnirtung harbour approach, Cumberland Sound | 66.0903°N 65.9935°W | 71% | 0.8 | 50 | 3,553 |
| Dorsch 2012 Regina Narrows, Chesterfield Inlet | 63.9931°N 94.1994°W | 71% | 0.9 | 13 | 14 |
| Rosaire A. Desgagnes 2025 Arctic Bay / Adams Sound approach (position disputed: Shipfax says Arc | 73.0674°N 84.4665°W | 83% | 0.4 | 32 | 7,335 |
File strike_predictions_2026-09-03.csv · SHA-256 a33994d6999ab30b94fc2ca69e294a4ebb8b7fc29fcbb7f5c247ce50a4df2322 · .ots.
Exhibit Lthe reported-dangers test
1,558 places where a mariner reported the chart was wrong, and where the model had put its flags
The Canadian Coast Guard publishes every navigational warning in force: uncharted rocks, shoals, depths shallower than charted, submerged objects, each with a position and often a measured least depth. Nobody had scored a seabed model against them. We crawled all 1,625 notices in force on 6 September 2026, kept the 510 in the danger categories (Shallow Depth Confirmed 1114, Shallow Depth Reported 317, Submerged Object 50, Shoal 33), and parsed 1,558 positions, 460 with a stated depth and 94 in the Arctic. For each position we asked the hazard field the same question the grounding hindcast asks: among apparently-safe water within 25 km, what percentile of danger did the model give this exact spot? Ten percent of safe water sits above the 90th percentile by construction, so the base rate is exact.
| Subset | n | Old head, top decile | New head, top decile | Nearest-sounding rule, top decile | p vs 10% (new head) |
|---|---|---|---|---|---|
| Chart says the water is safe at the position (deeper than 21 m) | 107 | 34 (32%) | 36 (34%) | 40 (37%) | 3e-11 |
| … and no published sounding within 300 m | 37 | 8 (22%) | 10 (27%) | 7 (19%) | 0.003 |
| … and no published sounding within 1 km | 22 | 4 (18%) | 3 (14%) | 1 (5%) | 0.380 |
| Arctic notices only | 40 | 10 (25%) | 11 (28%) | 9 (22%) | 0.001 |
| Notices stating a measured depth of 21 m or less | 13 | 4 (31%) | 8 (62%) | 5 (38%) | 8e-06 |
Read it straight. Where the chart calls the water safe, the model puts 36 of 107 reported dangers in its top decile, three times chance. With no published sounding within 300 m of the report, the position the model could not have copied from a neighbour, it is 10 of 37 against 7 for the rule “danger is where the nearest sounding is shallow”. On notices that state a measured depth of 21 m or less in water the chart called safe, the retrained head lands 8 of 13 (old head 4). Where a sounding sits right beside the notice, the simple rule ties or beats the model: there the rule already knows the answer, and the model’s edge is in the water between the soundings. The samples are small and we say so; the table is the whole result, and the files are in the repository.
Source: nis.ccg-gcc.gc.ca NAVWARN search, all notices in force, crawled 2026-09-06. Notices in the “Shallow Depth Confirmed” category mostly follow a CHS survey and may already be in the 2026-08-29 NONNA snapshot the field was computed from, which is why the table conditions on the chart still calling the water safe and on the distance to the nearest published sounding. Files: navwarn/danger_points.csv, navwarn/navwarn_hindcast_v2.csv, navwarn_hindcast.py in the validation repository.
Exhibit Kthe country
The same questions, asked of all of Canada’s water
The national temporal test
Trained on pre-2016 soundings only, scored on 20.4 million post-2016 marine soundings across 300 blocks and three oceans: model 12.6 m, nearest sounding 19.7 m, gravity 15.7 m; 74% of errors inside 1σ (all 20.9M cells). On 0.54M cells in inland lakes and fjord heads the gravity anchor is invalid and the model fails with it (79 m): do not use this model on inland water.
The age of Canada’s chart
Of 215 million sounded cells in the national archive, 28% rest on surveys older than 1980 and 8% older than 1960; 47% are post-2016 multibeam. The map below colours every cell by the decade of its survey.
The global chart’s lag
On 73,155 km² of corridor water where CHS holds real soundings, the GEBCO-based global grid that foreign ships fall back on is off by more than 10 m on 14% of cells and deep-biased, the dangerous direction, on 6% (4,523 km²). Along the Churchill route: 16% of points off by 10+ m, 10% deep-biased, worst case 122 m deeper than the archive.
The national survey plan
The corridor plan, extended to every NONNA block: the 20 highest-uncertainty half-degree boxes of inferred water, 39,569 km², 989 ship-days, priced from CHS’s own Arctic contract rate to the icebreaker charter rate. A federal charting line with a number on it.

Every resupply lane, graded
A 15 km approach zone around each sealift community and port: share of water with a published sounding, the median year of those surveys, the share from before 1980, and where the hazard field covers it, the share of apparently-safe water it flags. The oldest lanes first. Milne Inlet, the one lane industry paid to survey, is the control: 98% sounded, median 2017.
| Community / port | Sounded | Median survey year | Pre-1980 | Safe water flagged |
|---|---|---|---|---|
| Naujaat | 27% | 1955 | 54% | — |
| Deception Bay (Raglan) | 56% | 1960 | 81% | 100% |
| Clyde River | 46% | 1970 | 72% | — |
| Baker Lake (inlet route) | 100% | 1974 | 100% | — |
| Sanikiluaq | 22% | 1983 | 41% | 50% |
| Churchill MB | 30% | 1992 | 0% | 28% |
| Kugaaruk | 72% | 1992 | 0% | — |
| Gjoa Haven | 41% | 1995 | 0% | 31% |
| Taloyoak | 62% | 1995 | 0% | 42% |
| Cambridge Bay | 76% | 1995 | 0% | — |
| Qikiqtarjuaq | 66% | 2001 | 36% | — |
| Arctic Bay | 59% | 2001 | 20% | — |
| Pond Inlet | 98% | 2001 | 0% | — |
| Pangnirtung | 90% | 2003 | 0% | — |
All 26 lanes in community_cards.json. Median year uses 2017 for soundings outside the 1832–2016 index (modern multibeam).
What did not work, on the record
NASA’s laser. ICESat-2 ATL24 seafloor photons, 22 block-passes over 12 corridor boxes, ~3.6 million photons: where the fitted datum offset is physical, the laser agrees with CHS soundings to 1–5 m, which independently checks the archive, but only 124 photon cells with no published sounding survive the quality gates in this turbid water. The laser cannot referee the model’s fills here; we tried and say so. The era audit. Where CHS re-surveyed water after 2016, the older soundings within 200 m agree with the new ones to about a metre in every decade back to 1900 (1950-1960: 1.4 m, 1960-1970: 1.0 m, 1970-1980: 0.8 m, 1980-1990: 0.9 m, 1990-2000: 1.3 m). A null result with a lesson: old soundings agree with modern re-surveys to about 1 m in every decade; the risk of old charts is the water between the soundings, not the soundings.
Exhibit Athe corridor, found
The channel no one drew — computed from depth and uncertainty
Given only the completed seabed and its σ field, the model traced the least-risk channel from Churchill to the Atlantic itself: 2,782 km, never shallower than 22 m, mean σ of 2.7 m — and not one kilometre over unanswered water. Where the straight route crosses red, the found channel goes around. Read it as a map of where the risk is, not as a sailing direction: the channel is 455 km longer than the straight route, about 20 hours at 12 knots, roughly 21 t of fuel and one day of hire per voyage (a Handysize at ~25 t/day; ~US$25k). Nobody should pay that on every voyage; the point is that the water the straight route crosses has never been answered for, and that is what the survey plan below is priced to fix.

Exhibit Bprovenance
The corridor, completed — and honest about which pixel is which

Exhibit Cuncertainty
Where the corridor is still uncertain

Exhibit Dthe stakes
Tasmania Islands, Franklin Strait — September 6, 2025
The MV Thamesborg, an ice-class freighter bound from China to Baie-Comeau, struck what the Transportation Safety Board calls an “uncharted shoal” (case M25C0241) at the western tip of the Tasmania Islands. Salvage took a month and an icebreaker. In July 2026 the Dutch Maritime Disciplinary Court suspended the Master’s licence for deliberately routing through a zone whose survey reliability was rated CATZOC C — poorly surveyed water — when a better-charted lane lay further west. In the published archive, 55% of this water has no sounding. The ship struck 1.7 km past the edge of the surveyed swath — and the model, which had never seen that seabed, ranks the strike site in the 98th percentile of uncertainty for the whole strait (calibrated σ ≥ 14 m at 68%, ≥ 20 m at 95%). CHS’s own Survey Index shows the nearest dated survey to the site is a 1960 single-beam line graded CATZOC C; the modern multibeam swath ends 1.7 km short of the strike. The right panel is the same water, completed.

Exhibit Ethe plan
Where a survey ship earns its day rate first
The σ map, converted to procurement: the ten highest-uncertainty boxes within 35 km of the route, priced in ship-days. Coverage assumption: 40 km²/day, from a multibeam swath of ~3× water depth (300–400 m at 100–130 m), 8 knots for 20 hours (~300 line-km/day, ~100 km² raw), 20% line overlap and a 50% weather-and-ice downtime factor across an Arctic season. Two public contracts bracket the cost. Lower bound: CHS Arctic hydrographic contract to Sedna ROV Services (Iqaluit), C$6.5M over two seasons, 9,000+ line-km in the first (DFO, March 2024): ~C$720 per line-km; at a 350 m swath with 20% overlap, ~C$2,600 per km², which prices the plan’s 8,753 km² at about C$23M. Upper bound: the Coast Guard’s July 2026 polar-icebreaker charter at C$183,000/day (C$22M for ~120 days), which the table uses. For scale, CCGS Amundsen 2021: ~38,700 km² mapped over an ~80-day season (Copernicus ESSD 2024), i.e. several hundred km²/day in transit mapping of deep water; 40 km²/day is conservative for 100–130 m shelf water.
Total: ~219 ship-days for 8,753 km²: C$23M at the CHS contract rate, C$40.1M at the icebreaker charter rate to de-risk the worst water on the route — a fundable season, against “more than a decade” for full conventional coverage.
Exhibit Ha forecast you can fail
1,314 predicted depths, sealed on 2026-09-02 — with a clock we do not control
Every cell in this file has no published sounding today. 314 sit on the found channel; the rest are drawn at random across the corridor. Each carries a predicted depth and calibrated 68% / 95% bands. The next CHS, Coast Guard or research survey through this water scores it, and we publish the score, whichever way it goes.
| File | forecast_2026-09-02.csv |
| SHA-256 | 4d3f5dc8a5c2b50f3f72fba95384581fc778d6d453a3eec46aa2dc383c66be45 |
| Model | SeabedNet v5-small, the 34.8M-parameter completion model used throughout this page (trained on the full archive), with the depth gate and calibrated σ of Exhibit G |
| External timestamp | OpenTimestamps proof forecast_2026-09-02.csv.ots, submitted to three public calendars (Bitcoin-anchored; verify with ots verify), plus the hash in a GitHub commit in the validation repository. Neither clock is ours. |
| Scoring rule | A future survey scores this file: MAE, and the share of soundings inside the 68 % / 95 % bands. Anything outside CHS NONNA-100 as of 2026-08-29 counts. |
| Score so far | Archive re-checked 2026-10-04: 0 new soundings have appeared in the 94 corridor blocks that hold sealed cells, none yet at a sealed cell. The grader runs on the 1st of every month and publishes the score the day a sealed cell is sounded, good or bad (grades/latest.json). |
Exhibit Fthe completed product
Not just the corridor. Canada.
The same model, run over the entire national archive: all 437 NONNA blocks — three oceans and the Great Lakes. 429,682 km² of surveyed seabed extended by +1,088,182 km² of completed seafloor, every pixel carrying its own σ. This is the asset the corridor exhibits are cut from.


Method & the honest numbers
What we claim, and what we don’t
Independent multibeam, shelf water
Model vs nearest published sounding on 109,044 research-cruise cells CHS never published. Gravity prior: 5.5 m. The model’s advantage over gravity on this set is small, because cruises run where gravity already works; Test 2 is the shelf test.
Pre-2016 model, post-2016 soundings
6,460,612 corridor soundings CHS collected after its Survey Index closes, predicted by a model that never saw them. Nearest old sounding: 18.8 m. The gap widens with distance: 15.6 vs 25.4 m at 2–4 km.
Calibrated bands
Share of independent errors inside the published 68% and 95% bands after isotonic recalibration. Rank correlation of σ with error was 0.30 before, unchanged after.
Provenance and deferral
Inference is published only within 6 km of a real sounding; below 400 m the gravity prior is used because the tests say it is better there. “No published sounding” is never claimed to mean “never surveyed”: CHS holds data NONNA has not released.